

Key Takeaways
💰 H.B. Fuller offers a 1.41% dividend yield, backed by 55 consecutive years of increases and a conservative payout ratio of 33.73%, leaving substantial room for continued dividend growth.
💵 Free cash flow improved meaningfully to $224.6 million over the trailing twelve months, providing comfortable coverage of the annual dividend obligation and supporting the company’s capital return program.
📊 Seven analysts covering FUL carry an average price target of $71.71, with estimates ranging from $58 to $84, suggesting moderate upside from the current price near $65.70.
Updated 2/24/26
H.B. Fuller is a global leader in adhesives and sealants, serving essential markets like packaging, electronics, construction, and hygiene. With a history dating back to 1887 and operations in over 100 countries, the company has built a reputation for consistency and long-term dividend growth, including 55 consecutive years of dividend increases.
The stock has recovered considerably from its lows, now trading near $65.70 and approaching the upper end of its 52-week range of $47.56 to $68.63. Cash flow generation has improved substantially, earnings per share have climbed to $2.75, and management continues to press forward on its margin improvement strategy. The dividend ticked higher again in April 2025, reinforcing the company’s decades-long commitment to rewarding shareholders.
Recent Events
H.B. Fuller has been executing quietly but effectively over the past several months. The company raised its quarterly dividend from $0.223 to $0.235 per share beginning with the April 2025 payment, continuing an unbroken streak that now spans 55 years. That increase, while modest in dollar terms, signals that management remains confident in the durability of the company’s cash generation even in a complex macroeconomic environment.
On the operational side, the company has made visible progress in shifting its business mix toward higher-margin product lines, a priority that CEO Celeste Mastin has emphasized consistently in recent quarters. The adhesives market more broadly has stabilized after a period of raw material cost volatility and demand softness, which appears to have contributed to the improvement in free cash flow seen in the most recent trailing twelve-month period.
The stock has staged a meaningful recovery from its 52-week low of $47.56, gaining approximately 38% from that trough to its current price near $65.70. While that run has compressed the forward yield, it also reflects growing investor confidence that the earnings pressure of 2024 is giving way to a more normalized operating environment. The market cap now stands at approximately $3.57 billion, and with short interest at a modest 1.8 million shares, there is little sign of meaningful speculative pressure against the stock.
Key Dividend Metrics
📈 Forward Dividend Yield: 1.41%
💸 Forward Annual Dividend Rate: $0.94
🔒 Payout Ratio: 33.73%
📅 Last Dividend Payment: $0.235 (paid February 5, 2026)
📊 Dividend Growth Streak: 55 consecutive years
💵 Free Cash Flow (TTM): $224.6 million
📉 EPS (TTM): $2.75
Dividend Overview
H.B. Fuller’s current yield of 1.41% sits below the company’s historical average, a direct reflection of the stock’s recovery from its 52-week low rather than any reduction in the payout itself. The quarterly dividend now stands at $0.235, up from the $0.223 level that held through most of 2024, and the annual rate of $0.94 per share represents a continuation of the slow, deliberate growth that has defined this dividend program for more than five decades.
The company has now delivered 55 consecutive years of dividend increases, a track record that spans recessions, commodity cycles, and global supply disruptions. That consistency is not accidental. H.B. Fuller has structured its dividend to grow in line with earnings and cash flow, keeping the payout ratio conservative enough to maintain flexibility without sacrificing shareholder returns.
At 33.73%, the current payout ratio is actually more conservative than it was a year ago, which is a healthy development. With EPS at $2.75 and the annual dividend at $0.94, the company retains nearly two-thirds of its earnings for reinvestment, debt management, and opportunistic capital allocation. That buffer provides meaningful protection against short-term earnings volatility.
This is not a high-yield name for investors who need current income above all else. It is a compounder, a stock where the combination of modest yield, reliable growth, and reinvestment creates real wealth over time for patient shareholders.
Dividend Growth and Safety
The most recent dividend increase, from $0.223 to $0.235 per quarter beginning in April 2025, represents growth of approximately 5.4%, which is consistent with the measured pace Fuller has maintained across its 55-year streak. That kind of increase keeps the dividend meaningfully ahead of inflation without straining the company’s financial resources.
What makes the dividend feel particularly secure today is the improvement in free cash flow. At $224.6 million for the trailing twelve months, FCF has recovered sharply from the compressed levels seen in prior periods. The annual dividend obligation, covering roughly 54 million diluted shares at $0.94 per year, totals approximately $51 million, meaning free cash flow covers the dividend by more than four times. That is a comfortable margin by any standard.
Operating cash flow of $263.5 million reinforces the same picture. The business generates real cash, not just accounting income, and that cash generously supports the dividend even after capital expenditures. The profit margin of 4.38% is modest but consistent with the specialty chemicals industry, and return on equity of 7.94% reflects a business that is productive with its capital even in a moderately leveraged capital structure.
Looking ahead, dividend growth will likely remain in the low to mid single-digit percentage range, paced by earnings recovery and continued free cash flow improvement. The payout ratio has room to move higher before it becomes a concern, but management has shown no inclination to accelerate the pace dramatically. For income investors, that restraint is actually a virtue, because it preserves the sustainability of the streak that makes this dividend so valuable.
Chart Analysis
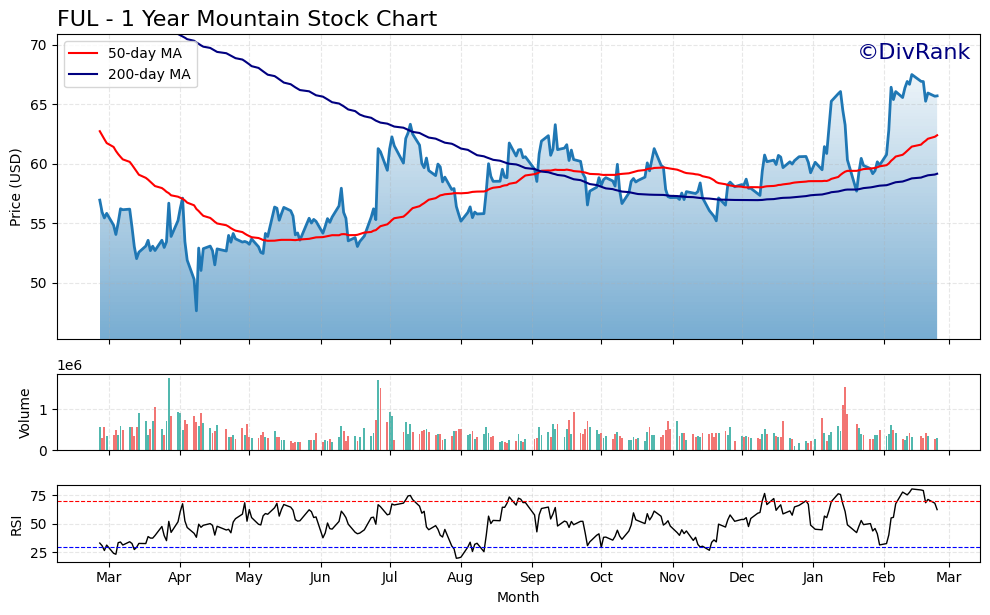
H.B. Fuller’s price action over the past year tells a compelling recovery story. Shares bottomed near $47.66 at the 52-week low before staging a sustained rally that has carried the stock to its current level of $65.70, representing a gain of nearly 38% off that trough. The stock is now within striking distance of its 52-week high of $67.49, sitting just 2.65% below that ceiling. That kind of range compression near a multi-month high is typically a sign of underlying demand absorption rather than distribution, and for a dividend growth name like FUL, it suggests the market is repricing the business on firmer fundamental footing.
The moving average picture adds further conviction to the bullish read. FUL is trading above both its 50-day moving average of $62.40 and its 200-day moving average of $59.17, with the 50-day now positioned above the 200-day in what technicians recognize as a golden cross formation. Golden crosses are meaningful not because they predict the future with certainty, but because they confirm that near-term price momentum has caught up with and surpassed the longer-term trend. The spread between the two averages is widening, which suggests the move higher has been orderly and persistent rather than a short-term spike driven by a single catalyst.
The current RSI reading of 62.52 lands in constructive territory. The indicator is elevated enough to confirm genuine buying interest but stops well short of the 70-plus zone where overbought concerns typically emerge. That positioning often represents a sweet spot for income investors evaluating entry, as it reflects a stock with real momentum that has not yet priced in excessive optimism. If FUL consolidates modestly near current levels before making another attempt at the 52-week high, the RSI would have room to reset before the next leg, which is a healthier setup than a vertical run with readings deep in overbought territory.
For dividend investors, the technical backdrop here is about as clean as it gets for a mid-cap specialty chemicals company. The trend is up across every major timeframe, the moving average structure is supportive, and momentum is firm without flashing warning signals. Investors building or adding to a position are not chasing a parabolic move. The stock is recovering from a meaningful drawdown in an organized fashion, and the proximity to the 52-week high suggests the next meaningful test will be whether FUL can break out to fresh highs and hold them. A position initiated near current levels has well-defined technical support just below at the 50-day moving average, giving income-focused holders a reasonable framework for managing downside risk while collecting the dividend.
Cash Flow Statement
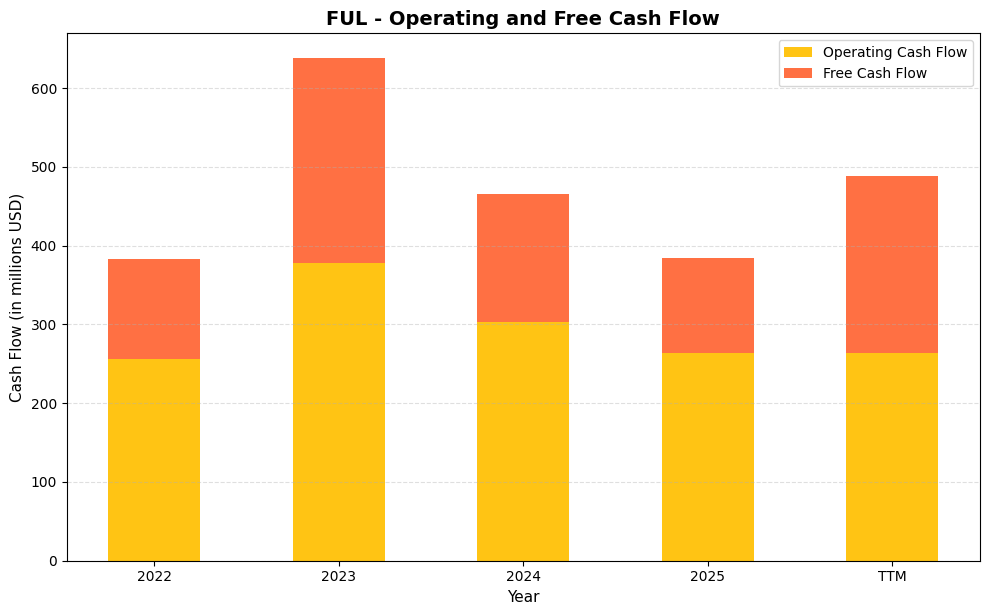
H.B. Fuller’s operating cash flow has followed a volatile but generally constructive path for dividend investors. The company generated $256.5 million in operating cash flow in 2022, then surged to $378.4 million in 2023, a peak that reflected improved working capital management and margin recovery following a difficult inflationary period. From there, operating cash flow pulled back to $302.4 million in 2024 and further to $263.5 million in 2025, which also represents the TTM figure. Free cash flow tracked a similar pattern, climbing from $126.6 million in 2022 to $259.3 million in 2023 before retreating to $163.2 million in 2024 and $121.2 million in 2025. The TTM free cash flow figure of $224.6 million is notably higher than the fiscal 2025 figure, suggesting some improvement in the most recent trailing period that provides a degree of comfort for near-term dividend coverage. With annual dividend obligations running well below free cash flow generation at current levels, the payout remains comfortably funded even in a softer cash flow environment.
The broader trend across these four years tells a story of a business that is capable of meaningful cash generation but is working through a normalization cycle after an exceptional 2023. Capital expenditures have consumed a meaningful share of operating cash flow, with the gap between operating and free cash flow ranging from roughly $39 million to $129 million depending on the year, reflecting ongoing investment in the company’s manufacturing and integration capabilities following the Royal acquisition. The 2023 peak demonstrated what FUL can produce when working capital headwinds subside and pricing holds, and while 2025 represents a step down from that high watermark, free cash flow of $121.2 million to $224.6 million on a TTM basis still leaves ample room to cover dividends, service debt, and pursue incremental shareholder returns. For dividend growth investors, the key takeaway is that FUL’s cash generation has a demonstrated floor that supports the current payout, even as management navigates a more demanding volume and margin environment.
Analyst Ratings
Seven analysts currently cover H.B. Fuller, and the distribution of price targets tells a story of measured optimism. The average 12-month price target sits at $71.71, which represents approximately 9% upside from the current price of $65.70. The range is fairly wide, with the most cautious target at $58 and the most bullish at $84, reflecting genuine disagreement about how quickly the company’s margin improvement initiatives will translate into earnings growth.
At the low end, the $58 target implies a modest pullback from current levels, suggesting that some analysts believe the recent stock recovery has gotten slightly ahead of the fundamental story. At the high end, the $84 target would require a re-rating of the business toward a more premium multiple, which is plausible if EBITDA margins continue trending toward management’s long-term targets. The mean target of $71.71 implies that the consensus view is constructive but not exuberant, which is a reasonable posture given where the stock has traveled over the past year. The current P/E of 23.89 is not cheap in an absolute sense, but it is more defensible given the trajectory of cash flow improvement and the company’s demonstrated ability to protect the dividend through difficult periods.
Earnings Report Summary
H.B. Fuller’s most recent reported results reflect a business working through a transitional period with genuine underlying momentum. Revenue for the trailing twelve months totaled $3.47 billion, slightly below the prior year comparable but directionally consistent with a business that has been pruning lower-margin operations and focusing on mix improvement. EPS came in at $2.75, a significant step up from the $1.99 reported in the prior year comparison, driven by improved cost management, better pricing discipline, and the benefit of earlier restructuring actions.
Net income of $152 million and an operating cash flow of $263.5 million reflect a business that is running more efficiently at the cash level than the headline revenue figure might suggest. Return on equity of 7.94% and return on assets of 4.88% are modest but moving in the right direction, consistent with a management team that has been deliberately shifting the portfolio toward more profitable product lines.
Leadership’s Outlook
CEO Celeste Mastin has remained focused on the company’s long-term margin targets, consistently pointing to pricing discipline, operational streamlining, and portfolio optimization as the primary levers for improvement. Her commentary has emphasized that the structural changes made over the past two years are beginning to show up in the financial results, and that the second half of the fiscal year historically represents a stronger cash generation period for the business. She has not wavered on the company’s commitment to the dividend or to its streak of annual increases.
Segment Performance
The Hygiene, Health and Consumable Adhesives segment continues to provide a stable demand foundation, benefiting from non-discretionary end markets that tend to hold up well regardless of broader economic conditions. Engineering Adhesives has been a more mixed story, with electronics demand providing a tailwind but continued softness in certain industrial end markets offsetting some of that strength. Building Adhesives has benefited from infrastructure and roofing activity, with organic trends improving as the construction cycle has shown signs of stabilization in key regions.
Regional Trends
Asia-Pacific continued to be a growth driver, with China representing a notable source of volume. Europe, the Middle East, and Africa showed resilience in hygiene-related demand. The Americas remained the largest revenue contributor but also the region most sensitive to cyclical shifts in the industrial and construction end markets. Overall, regional diversification continues to serve as a natural hedge against localized demand weakness.
What’s Ahead
Management’s focus for the coming quarters centers on continued margin expansion, debt reduction, and sustaining the free cash flow improvement that has characterized the trailing twelve months. Capital expenditures are expected to remain disciplined, and the company’s strong FCF coverage ratio gives it the flexibility to continue increasing the dividend, repurchasing shares opportunistically, and addressing its debt profile without being forced into difficult trade-offs. The earnings trajectory suggests that the company is past the trough of its recent earnings cycle, and the path toward management’s longer-term EBITDA margin targets appears more credible today than it did a year ago.
Management Team
Celeste Mastin has led H.B. Fuller as President and CEO since 2022, bringing a background in operations and commercial strategy that has shaped the company’s recent emphasis on margin improvement and portfolio discipline. Her tenure has coincided with a challenging macroeconomic backdrop, including raw material inflation, foreign exchange volatility, and demand softness in key industrial end markets, but she has maintained a consistent strategic message and has not retreated from the company’s long-term financial targets.
The broader management team reflects the operational complexity of running a global specialty chemicals business with customers across dozens of end markets and manufacturing footprints in multiple continents. Chief Financial Officer John Corkrean has been a steady presence on earnings calls, providing detailed guidance and reinforcing the company’s commitment to conservative financial management. Together, the leadership team has demonstrated a willingness to make difficult portfolio decisions, including divestitures of lower-margin businesses, in service of a longer-term profitability goal. For dividend investors, what matters most is that the team has shown it will protect the payout through cycles, and the 55-year streak is the clearest evidence of that commitment.
Valuation and Stock Performance
At $65.70, H.B. Fuller trades at a trailing P/E of 23.89 and a price-to-book ratio of 1.78, with book value per share at $36.98. The P/E multiple is not inexpensive in isolation, but it reflects a business where EPS has recovered significantly from the prior year’s depressed level, and where free cash flow generation provides a more favorable picture than the income statement alone might suggest. On a price-to-free-cash-flow basis, the stock trades at a more palatable multiple given the $224.6 million in trailing FCF against a market cap of $3.57 billion.
The 52-week range of $47.56 to $68.63 captures a remarkable recovery story. Investors who recognized the earnings trough in mid-2025 and bought near the lows have been well rewarded, with the stock now sitting near the top of that range. The beta of 1.09 suggests the stock moves roughly in line with the broader market, which is typical for a specialty industrial name with exposure to multiple economic cycles. At the current price, the stock is not a deep value buy, but neither is it priced for perfection. With the average analyst price target at $71.71, the implied upside is modest but positive, and the 1.41% yield provides some return while investors wait for the valuation gap to close. For long-term dividend investors, the more important question is whether the business can sustain and grow its earnings over the next five to ten years, and on that front, the evidence points favorably.
Risks and Considerations
H.B. Fuller carries a meaningful debt load that warrants ongoing attention. While the debt-to-equity ratio has been managed within historical ranges, the absolute level of leverage leaves the company more exposed to interest rate movements and refinancing risk than a less capital-intensive business. A sustained period of elevated rates or a deterioration in operating cash flow could compress the company’s financial flexibility, even if the dividend itself remains well covered by current free cash flow.
Raw material costs represent a persistent variable in the Fuller story. Adhesive formulations rely on petrochemical inputs and other commodity-linked materials, and price spikes can compress margins quickly in periods where the company cannot immediately pass costs through to customers. The company has demonstrated pricing discipline over recent cycles, but that discipline depends partly on competitive dynamics that can shift in a softer demand environment.
Geographic exposure adds another layer of complexity. Asia-Pacific, and China specifically, has been a meaningful growth contributor in recent quarters. Any material slowdown in that region, whether from domestic economic weakness, trade policy changes, or geopolitical disruption, would create headwinds for both revenue and earnings. The company’s diversification across dozens of end markets and geographies provides some cushion, but concentration in any single region always carries binary risk.
Finally, the current stock price, near the top of the 52-week range, reflects a considerable amount of optimism about the earnings recovery trajectory. If revenue growth disappoints or margin improvement stalls, the stock could give back some of its recent gains. The 1.41% yield offers limited income cushion in that scenario compared to higher-yielding alternatives in the specialty chemicals or broader industrials space. Investors entering at current prices are effectively paying for improvement that is still partly in progress rather than fully delivered.
Final Thoughts
H.B. Fuller is not the most exciting name in a dividend investor’s portfolio, and that is precisely what makes it worth owning. Fifty-five consecutive years of dividend increases is a record that requires genuine financial discipline, operational consistency, and a management culture that treats the shareholder commitment as non-negotiable. Those qualities do not appear overnight, and they do not disappear when one or two fiscal years turn difficult.
The business is in a better place today than it was twelve months ago. Free cash flow has improved substantially, EPS has recovered, the payout ratio has room to absorb a period of slower earnings growth if needed, and the stock has rewarded patient investors who looked past the trough. The dividend itself, while modest at 1.41%, is growing steadily and is covered by a comfortable margin.
For investors focused on total return over a multi-year horizon, the combination of a recovering earnings profile, a disciplined management team, and a dividend streak that few companies in any industry can match makes FUL a reasonable core holding. It is not a name to chase for yield alone, but for investors who value the compounding power of reliable, growing income from a real, cash-generating global business, H.B. Fuller continues to earn its place.