

Updated 2/24/26
Griffon Corporation (GFF) operates through two core segments: Home and Building Products, and Consumer and Professional Products. With brands like Clopay and AMES under its umbrella, the company serves both residential and commercial markets, generating approximately $2.5 billion in annual revenue. Leadership has emphasized operational efficiency, steady margin expansion, and a disciplined approach to capital allocation, including dividends and share repurchases.
Backed by a consistent free cash flow profile of over $228 million in the trailing twelve months, Griffon is navigating a moderating demand environment while maintaining profitability. The company continues to return capital to shareholders, manage its balance sheet carefully, and invest in long-term value creation.
Recent Events
Griffon has been active on the capital return front in recent months, raising its quarterly dividend to $0.22 per share in November 2025, a meaningful step up from the $0.18 rate that had been in place since late 2024. The increase reflects management’s ongoing confidence in the company’s cash generation and its stated commitment to growing the dividend over time. The stock has recovered substantially from its 52-week low of $63.92, trading at $87.48 as of February 24, though it remains below the 52-week high of $97.58 set earlier in the cycle.
The company continues to execute on its two-segment model, with the Home and Building Products division anchoring overall profitability through strong EBITDA margins, while the Consumer and Professional Products segment has benefited from a leaner operating structure and improved sourcing efficiency. Australia remains a consistent bright spot within the CPP segment, providing geographic diversification at a time when North American and UK demand has been more subdued.
Griffon has also remained active in its share repurchase program, using its strong free cash flow to reduce the share count and support per-share metrics. These efforts, combined with steady dividend growth, reinforce the company’s reputation as a disciplined allocator of capital in a cyclical industry that often rewards patience.
Key Dividend Metrics
📈 Forward Dividend Yield: 0.88%
💸 Annual Dividend: $0.88 per share
📅 Most Recent Quarterly Dividend: $0.22 per share
📆 Most Recent Dividend Payment: November 28, 2025
📊 Payout Ratio: 75.25%
💰 Free Cash Flow: $228.6 million
The yield is modest, but the dividend’s trajectory and the company’s free cash flow coverage tell a more encouraging story for long-term income investors.
Dividend Overview
Griffon’s 0.88% forward yield will not attract investors who prioritize current income above all else, but that framing misses the more important narrative. The company has been steadily building its payout since reintroducing quarterly dividends, and the November 2025 increase to $0.22 per share per quarter represents the latest in a series of deliberate upward moves. From $0.125 per quarter in mid-2023, the dividend has grown to its current level, marking a gain of roughly 76% in just over two years.
The payout ratio has moved to 75.25% on a trailing earnings basis, which is elevated relative to prior years and warrants attention. However, the more relevant measure for Griffon’s dividend safety is free cash flow coverage rather than earnings-based ratios alone, given the company’s capital structure and accounting treatment. Free cash flow of $228.6 million comfortably exceeds the dividend burden, providing meaningful headroom even as the payout has grown.
Dividends are paid quarterly, and the schedule has been consistent throughout the dividend’s history since reinstatement. For income investors willing to prioritize dividend growth over starting yield, Griffon’s recent track record offers a compelling case. The company is not stretching to fund its dividend; it is funding it from operations and choosing to grow it alongside earnings.
Dividend Growth and Safety
The most recent dividend increase, from $0.18 to $0.22 per quarter in November 2025, represents a 22% jump at the quarterly level and brings the annualized payout to $0.88 per share. That is the kind of growth rate that can meaningfully improve an investor’s yield on cost over a multi-year holding period, even when the starting yield appears thin.
Looking back across the dividend history provided, the pattern is clear and consistent. After a special dividend in May 2023, the company moved to a regular quarterly structure at $0.125, raised it to $0.15 by November 2023, held that rate through mid-2024, then stepped it up to $0.18 in November 2024 before another increase to $0.22 in November 2025. That kind of annual cadence of raises suggests a management team that has internalized dividend growth as a capital return priority rather than treating it as an afterthought.
From a safety standpoint, operating cash flow of $319.5 million and free cash flow of $228.6 million provide solid coverage of the roughly $40 million in annual dividend obligations implied by the current payout rate. The payout ratio on a reported earnings basis looks elevated at 75%, but that figure reflects the gap between GAAP net income and the company’s actual cash generation capacity, which remains healthy.
Chart Analysis
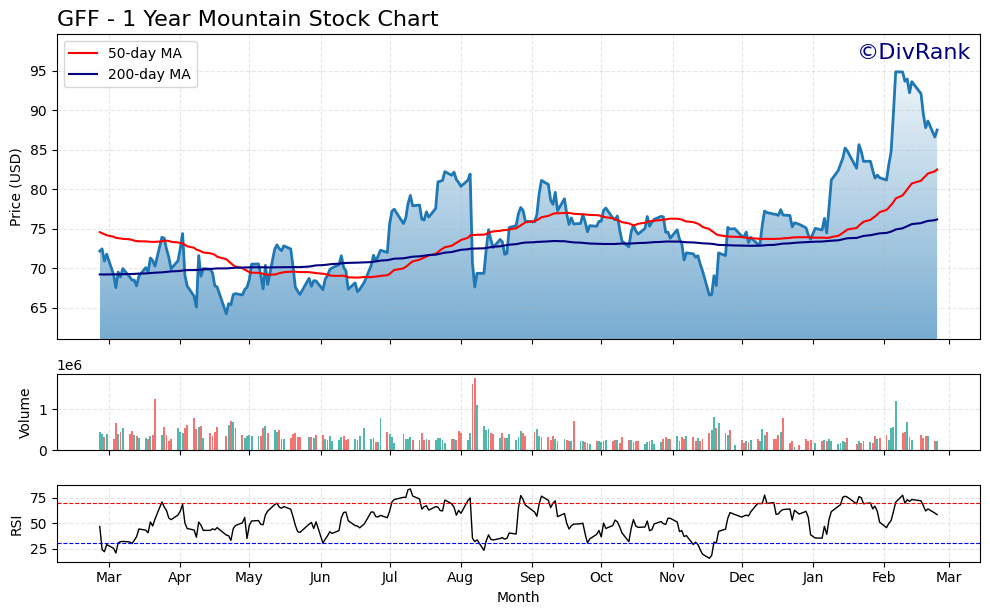
Griffon’s price action over the past year tells a constructive story for income investors watching from the sidelines. The stock has climbed roughly 36% off its 52-week low of $64.22, reaching a current price of $87.48 and sitting within 8% of its 52-week high of $94.84. That kind of recovery from trough to near peak reflects sustained buying interest rather than a short-term bounce, and the shape of the move suggests accumulation has been orderly rather than speculative. The broader trend is clearly higher, and GFF has spent the better part of the past several months building a base well above where it started the year.
The moving average picture reinforces that bullish read. GFF is trading above both its 50-day moving average of $82.49 and its 200-day moving average of $76.17, and the 50-day has crossed above the 200-day to produce what technicians call a golden cross. That configuration, where the shorter-term average rises through the longer-term average, is generally interpreted as a confirmation that the intermediate trend has aligned with the longer-term trend. With the current price sitting roughly 6% above the 50-day and more than 14% above the 200-day, the stock has meaningful cushion before either average would come into play as support on a pullback.
Momentum, as measured by the 14-day Relative Strength Index, registers at 58.41. That reading places GFF in a healthy middle ground, above the neutral 50 threshold that separates improving momentum from deteriorating momentum, but well clear of the overbought territory above 70 that sometimes precedes short-term consolidation. In practical terms, the RSI reading suggests there is room for additional upside without the stock being technically stretched. Buyers appear to retain control of the tape without having pushed the name into a zone that historically invites profit-taking.
For dividend investors, the technical backdrop here is about as clean as it gets without chasing a stock into overbought conditions. The trend is intact, the moving averages are properly stacked in bullish order, and momentum has room to run. The only caution worth flagging is that proximity to the 52-week high, as GFF would need a relatively modest push to test $94.84, a level that may attract some selling pressure on the first attempt. Investors looking to initiate or add to a position may find that any brief consolidation near the 50-day moving average offers a more favorable entry point than chasing the stock at current levels.
Cash Flow Statement
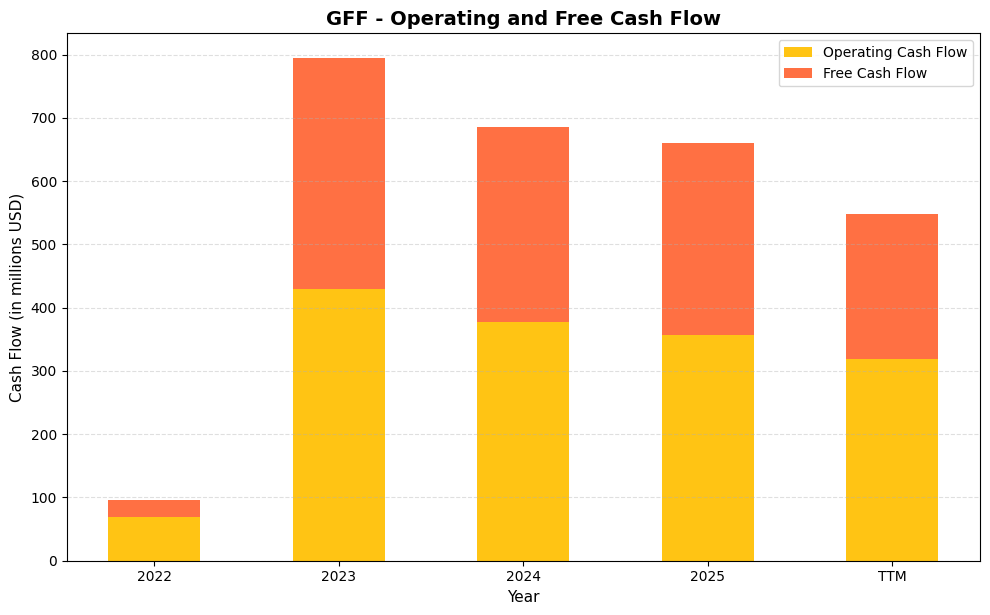
Griffon’s cash flow profile tells a compelling story for dividend investors. Operating cash flow surged from a modest $69.4 million in fiscal 2022 to a peak of $428.8 million in 2023, a move that fundamentally repositioned the company’s capacity to reward shareholders. Free cash flow followed the same trajectory, jumping from just $27.0 million in 2022 to $365.2 million in 2023 before settling into a more normalized range of $308.9 million in 2024 and $303.6 million in 2025. Even with the TTM figure moderating further to $228.6 million in free cash flow, the company is generating a level of cash that comfortably covers its dividend obligations many times over, leaving substantial room for buybacks, debt reduction, or continued dividend growth without placing meaningful strain on the balance sheet.
The trajectory here reflects a business that went through a genuine transformation rather than a temporary windfall. The 2022 baseline was suppressed by working capital consumption and integration costs tied to GFF’s portfolio reshaping, so the step-change into 2023 represented a normalization of earnings quality as much as an improvement in operations. Capital expenditures have remained disciplined throughout this period, with the spread between operating and free cash flow holding in a relatively tight range of roughly $50 million to $75 million annually in the more recent years, suggesting the business does not require heavy reinvestment to sustain its earnings power. For long-term shareholders, that capital efficiency is arguably the most important takeaway: Griffon is not burning cash to grow, it is converting revenue into distributable cash at a rate that gives management genuine flexibility on capital allocation priorities.
Analyst Ratings
Seven analysts currently cover Griffon Corporation, and the consensus price target data suggests a notably constructive view on the stock from current levels. The mean price target stands at $114.14, implying upside of approximately 30% from the current price of $87.48. The high target of $117.00 and the low of $108.00 define a range that sits uniformly above where the stock trades today, which is an unusual degree of alignment among covering analysts.
The bullish case rests on Griffon’s demonstrated ability to sustain strong EBITDA margins in its Home and Building Products segment, the ongoing efficiency improvements in Consumer and Professional Products, and the company’s track record of returning capital through both dividends and buybacks. At a time when the stock sits roughly 10% below its 52-week high, analysts appear to view the current price as an opportunity rather than a fair-value ceiling.
The absence of a formal consensus designation does not diminish the signal embedded in the price target distribution. A mean target of $114.14 against a current price of $87.48 represents one of the more compelling implied upside setups in the industrials space, and with no analyst carrying a target below $108, the floor of analyst expectations still sits well above current trading levels. That kind of structural alignment typically reflects confidence in earnings visibility and management execution rather than speculative optimism.
Earning Report Summary
Steady Execution in a Moderating Revenue Environment
Griffon’s most recently reported fiscal results reflect a company that continues to prioritize margin discipline and cash generation even as the top line has softened. Full-year revenue came in at approximately $2.54 billion, a modest decline from the prior year’s $2.6 billion, reflecting ongoing volume pressure in both segments. Net income of $44.6 million and EPS of $1.02 on a GAAP basis look restrained at first glance, but the more meaningful operational picture is captured in the cash flow and margin data rather than the headline earnings figure.
Operating cash flow of $319.5 million and free cash flow of $228.6 million confirm that the business is generating substantially more economic value than GAAP net income alone suggests. The gap between reported earnings and cash generation reflects depreciation, amortization, and working capital dynamics that are common in businesses of Griffon’s structure, and the cash figures are what ultimately fund the dividend, buybacks, and debt management.
Segment and Margin Dynamics
The Home and Building Products segment continues to anchor overall results, delivering EBITDA margins in the neighborhood of 30%, a level that stands out favorably among industrial peers. The Clopay garage door business has proven resilient to top-line moderation, benefiting from a mix shift toward higher-margin products and ongoing pricing discipline. The Consumer and Professional Products segment, operating under the AMES and related brands, has made meaningful progress on its cost structure, with the Australian operations in particular continuing to contribute positively.
Return on equity of 26.52% and return on assets of 13.02% both reflect productive capital deployment across the platform, and management has signaled continued commitment to the operational improvement agenda that has defined the company’s direction over the past several years.
Capital Allocation and Forward Priorities
CEO Ron Kramer has maintained a consistent message around capital allocation, balancing debt management with shareholder returns and organic reinvestment. The decision to raise the quarterly dividend to $0.22 in November 2025 signals confidence in the durability of free cash flow, and the share repurchase program has remained active as a complement to the dividend. Looking ahead, management’s priorities appear focused on defending margins, managing costs in a still-uncertain demand environment, and continuing to grow the dividend in line with earnings capacity.
Management Team
Griffon Corporation’s leadership is guided by a seasoned executive team with deep experience in industrial operations, financial stewardship, and long-term strategic planning. Ronald J. Kramer leads as Chairman and CEO, roles he has held since 2018 and 2008 respectively. His background in investment and executive leadership has shaped Griffon’s evolution into a more streamlined, shareholder-focused company. Kramer is known for his disciplined approach to capital allocation and his steady hand during market shifts.
Robert F. Mehmel serves as President and Chief Operating Officer, playing a key role in Griffon’s operational execution. His leadership is particularly evident in the day-to-day performance of the company’s two main segments. Brian G. Harris, Executive Vice President and Chief Financial Officer, brings strong financial acumen, overseeing everything from debt management to capital returns with a clear focus on maintaining fiscal discipline.
The broader leadership group includes legal, operational, and segment-specific heads who contribute to Griffon’s stability and execution. With a structure that balances operational detail with strategic oversight, the management team has successfully navigated economic cycles, maintained profitability, and directed resources to support both organic growth and disciplined capital allocation.
Valuation and Stock Performance
Griffon’s stock has had a significant move off its 52-week low of $63.92, with shares currently trading at $87.48. That represents a recovery of roughly 37% from the low, though the stock remains about 10% below the 52-week high of $97.58. The beta of 1.27 reflects a stock that moves with more than average market sensitivity, which is consistent with Griffon’s exposure to housing and consumer discretionary end markets.
The trailing P/E ratio of 85.76 looks elevated in isolation, but this figure is heavily influenced by the gap between GAAP net income and the company’s actual cash generation capacity. A company producing $228 million in free cash flow on a $4.1 billion market cap trades at roughly 17.9 times free cash flow, a substantially more reasonable valuation framing for an industrial business with improving margins and a growing dividend. The price-to-book ratio of 37.42 reflects the degree to which Griffon’s value resides in its intangible brand assets and earnings power rather than book assets alone.
With analyst price targets uniformly above $108 and a mean target of $114.14, the market appears to be pricing in more caution than the fundamentals strictly require. For investors with a patient time horizon, the combination of a growing dividend, an active buyback program, and meaningful analyst-implied upside creates a reasonably attractive total return setup from current levels. The stock is not cheap on traditional metrics, but the cash flow story provides a more grounded basis for valuation than headline earnings multiples suggest.
Risks and Considerations
Griffon’s most persistent risk remains its exposure to cyclical end markets, particularly residential construction and remodeling activity. The Home and Building Products segment is the company’s primary earnings engine, and a sustained downturn in housing starts or renovation spending could weigh materially on both revenue and EBITDA margins. The Federal Reserve’s rate environment has a direct bearing on housing affordability, and any prolonged period of elevated rates could suppress demand in ways that are difficult to fully offset through cost management alone.
The Consumer and Professional Products segment, while more efficient than it was several years ago, remains subject to shifts in retail demand across North America, the UK, and Australia. Consumer spending patterns have been uneven in the current economic environment, and the segment’s international exposure introduces currency translation risk that can affect reported results even when underlying operations are performing well.
The payout ratio of 75.25% on a GAAP earnings basis deserves monitoring. While free cash flow coverage remains solid, any material deterioration in operating cash flow would reduce the company’s flexibility to continue growing the dividend at the pace it has set over the past two years. Investors should watch the relationship between earnings and cash flow closely, as a widening gap in the wrong direction could eventually constrain capital return plans.
Griffon’s debt load, while being managed with discipline, remains meaningful and introduces interest rate sensitivity. The balance sheet leverage that amplifies return on equity in favorable conditions can work in reverse during periods of earnings pressure, and maintaining comfortable debt service coverage requires sustained operational execution.
Competitive dynamics in both segments are intense. Clopay competes in a fragmented but increasingly competitive door market, and the AMES brands face pressure from private-label alternatives and larger diversified tool manufacturers. Griffon’s ability to defend market share depends on continued investment in product development, brand support, and customer service, all of which require ongoing resource allocation in a capital-constrained environment.
Final Thoughts
Griffon Corporation has spent the better part of the last several years becoming a more focused, cash-generative, and shareholder-oriented industrial business. The results of that effort are visible in the dividend history, which has grown from $0.125 per quarter in 2023 to $0.22 today, in the free cash flow profile that comfortably funds that growing payout, and in the analyst community’s uniformly constructive price targets that sit well above current trading levels.
The stock is not without complexity. The GAAP earnings picture understates true cash generation, the P/E ratio looks stretched at face value, and cyclical risks tied to housing and consumer demand are real. But for investors who are willing to look through the headline metrics to the underlying cash flow and capital return story, Griffon offers a combination of dividend growth momentum, operational discipline, and potential valuation upside that is worth serious consideration. Management has earned credibility through consistent execution, and there is no obvious reason to expect that approach to change.