

Key Takeaways
📈 Goldman Sachs offers a 1.57% forward dividend yield with a meaningful step-up in the quarterly payout to $4.00 per share and a conservative 27.28% payout ratio, supporting strong dividend sustainability.
💵 Goldman’s annual dividend now stands at $18.00 per share, reflecting a significant increase from the prior $12.00 annual rate, driven by a jump in the quarterly payment beginning in mid-2025.
📊 Analyst consensus sits at “Hold” with a mean price target of $959.20, suggesting modest upside from current levels as the stock trades near $902.27 after a strong run over the past year.
Updated 2/24/26
Goldman Sachs stands as one of the most influential financial institutions in the world, with deep roots in investment banking, trading, and asset management. Backed by a seasoned leadership team and a strong balance sheet, the firm continues to deliver consistent performance across its core businesses.
With a forward dividend yield of 1.57% and a payout ratio of just over 27%, Goldman offers a steady stream of income alongside long-term growth potential. The firm posted revenue of nearly $59.4 billion and net income of $16.3 billion over the trailing twelve months, reflecting continued strength in trading and a recovery in capital markets activity. The quarterly dividend jumped to $4.00 in the second half of 2025, marking one of the most decisive increases in the firm’s recent history.
Recent Events
Goldman Sachs has been active on multiple fronts heading into early 2026. The firm’s equities and fixed income trading businesses continued to benefit from elevated market volatility and strong client engagement, themes that have persisted since mid-2025. Investment banking activity, which lagged in early 2025 due to client hesitation around economic policy, has shown signs of recovery as deal pipelines mature and corporate confidence improves. CEO David Solomon has pointed to a more constructive environment for mergers and advisory work entering 2026, citing a clearer interest rate backdrop and improving CEO sentiment around capital deployment.
Goldman also continued its push into artificial intelligence and technology infrastructure, with CIO Marco Argenti overseeing a broad initiative to embed AI tools across trading, risk management, and client services. The firm’s asset and wealth management division has attracted steady inflows, reflecting both the strength of Goldman’s brand and growing demand for alternative investment solutions among institutional and high-net-worth clients. On the capital return front, Goldman’s $40 billion share repurchase authorization, announced in early 2025, remains active, and buyback activity has contributed to earnings per share growth alongside strong underlying profitability.
The firm also raised its quarterly dividend to $4.00 per share beginning with the August 2025 payment, up from $3.00, representing a 33% increase in the quarterly payout. That move brought the annualized dividend to $18.00 per share and signaled management’s confidence in the sustainability of earnings well above current dividend requirements.
Key Dividend Metrics
📈 Forward Dividend Yield: 1.57%
💸 Annual Dividend Payout: $18.00 per share
📆 Last Dividend Payment: $4.00 per share (December 2, 2025)
🔄 Payout Ratio: 27.28%
📊 5-Year Average Yield: 2.28%
🚀 Dividend Growth Rate: Accelerating, with a 33% quarterly increase in mid-2025
🏛 Dividend Payment History: Predictable, no interruptions
Dividend Overview
There’s a quiet reliability to how Goldman handles its dividend strategy, but the most recent move was anything but quiet. The firm raised its quarterly dividend from $3.00 to $4.00 beginning in August 2025, a 33% increase that brought the annualized payout to $18.00 per share. For a stock that tends to grow its dividend in measured increments, this was a notable acceleration and a clear signal from management that the earnings base has expanded to a point where more aggressive capital return is both appropriate and sustainable.
The forward yield of 1.57% reflects the stock’s strong price appreciation over the past year more than any hesitation on dividend growth. As the share price has climbed toward $902, the yield has compressed relative to earlier periods, but the absolute dollar payout has grown substantially. With a payout ratio of 27.28% against earnings per share of $51.88, Goldman’s dividend consumes a small fraction of its profits, leaving ample room for continued increases or additional buybacks. Income investors who purchased Goldman at lower prices are now collecting a meaningfully higher effective yield on their cost basis.
The ex-dividend date for the most recent $4.00 quarterly payment fell on November 28, 2025, with payment delivered on December 2. Goldman has maintained a consistent quarterly payment schedule, and investors have come to rely on that predictability. The combination of a growing payout, a conservative ratio, and strong underlying earnings makes the dividend profile here as sound as it has been in years.
Dividend Growth and Safety
Goldman’s dividend trajectory over the past few years illustrates a firm that has moved from cautious to confident in its capital return posture. In early 2023, the quarterly dividend stood at $2.50 per share. By the end of 2025, it had reached $4.00, representing a 60% increase in the quarterly payment over roughly two and a half years. The most dramatic step came in August 2025, when the firm skipped its usual modest increment and instead delivered a full dollar increase in a single move, bringing the quarterly rate to $4.00 from $3.00.
The safety of this dividend is well-supported by fundamentals. Net income of $16.3 billion and earnings per share of $51.88 provide an earnings cushion of nearly four times the annual dividend obligation. Return on equity of 13.88% reflects a business generating strong returns on its capital base, and a profit margin of 28.92% on nearly $59.4 billion in revenue confirms that profitability is both broad and durable. Goldman’s conservative payout ratio ensures that even in a challenging year for trading or banking revenues, the dividend would remain well-covered.
The stock itself has reflected this fundamental strength. Over the past 52 weeks, shares have ranged from $439.38 to a high of $984.70, and the stock currently trades near $902.27, representing a substantial move off its lows. Beta remains at 1.31, meaning Goldman will tend to move more than the broader market in either direction, which is a consideration for more conservative income investors. However, for those with a longer time horizon, the firm’s track record of growing through market cycles and consistently increasing the dividend argues strongly in favor of patience through periods of volatility.
Goldman’s PEG ratio and broader valuation suggest a firm that is not priced for explosive growth but rather for steady, reliable compounding. That suits dividend-focused investors well. The business model continues to generate substantial free cash for capital return, and management has demonstrated a willingness to share those gains with shareholders in the form of both dividends and buybacks. The dividend here doesn’t demand attention. It just keeps growing, and for many investors, that consistency is the point.
Chart Analysis
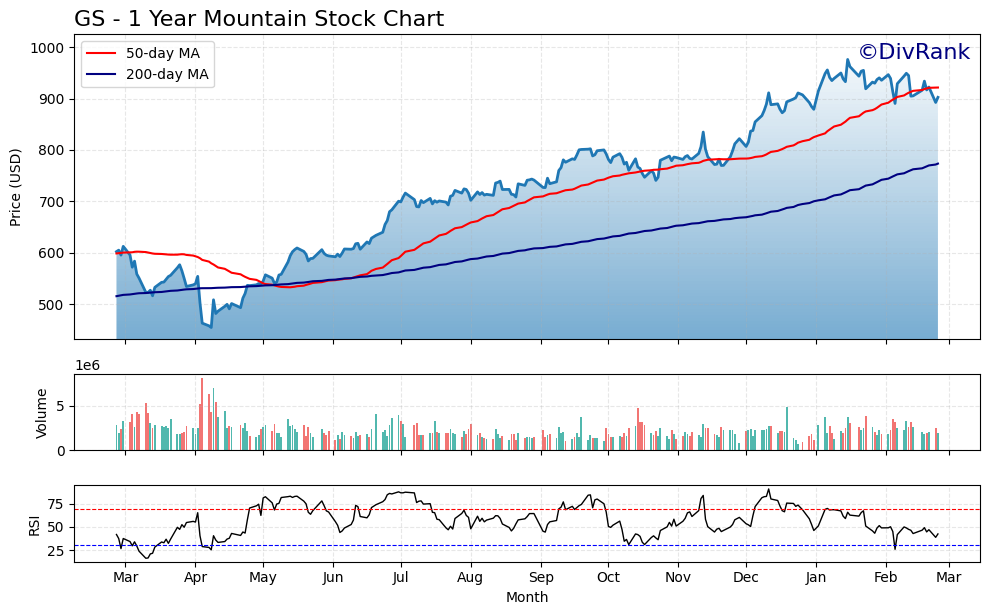
Goldman Sachs has staged a remarkable recovery over the past year, with shares climbing from a 52-week low of $455.22 to the current price of $902.27, representing a gain of roughly 98% from the trough. That kind of price appreciation is unusual for a large-cap financial, and it reflects a significant re-rating of the stock as the interest rate environment, deal-making activity, and broader market sentiment shifted in GS’s favor. The stock reached a 52-week high of $975.86 before pulling back modestly, and at the current price of $902.27, it sits just 7.54% below that peak. For dividend investors, the underlying price trajectory matters because it signals balance sheet confidence and earnings resilience, both of which underpin dividend sustainability.
The moving average picture is constructive. Goldman is trading above its 200-day moving average of $773.57 by a substantial margin, confirming that the longer-term trend remains firmly positive. The 50-day moving average currently sits at $921.34, and the stock is trading modestly below that level, which reflects the near-term consolidation following the run toward the 52-week high. Importantly, the 50-day moving average is positioned well above the 200-day moving average, a condition known as a golden cross, which technical analysts generally interpret as a bullish long-term signal. The current setup suggests the recent softness is a pause within an uptrend rather than a structural breakdown.
The RSI reading of 42.46 adds some nuance to the picture. At that level, Goldman is approaching oversold territory without having fully reached it, suggesting that selling pressure has been present but has not become extreme. Momentum has clearly cooled from the levels that accompanied the surge toward $975.86, which is not unusual after a stock nearly doubles in twelve months. A reading in the low 40s often precedes stabilization or a modest bounce, particularly when the broader trend structure remains intact, as it does here. Income investors should view the current momentum backdrop as neutral to mildly constructive rather than a warning sign.
Taking the technical picture as a whole, Goldman Sachs appears to be in a healthy consolidation phase after an exceptional run. The stock is well above its long-term moving average, the golden cross formation is in place, and the RSI suggests the recent pullback has absorbed a meaningful portion of near-term selling pressure. For dividend investors, the key takeaway is that price action is not flashing any structural red flags. The 7.54% distance from the 52-week high represents a reasonable entry point relative to where this stock was trading just twelve months ago, and the technical setup supports the thesis that GS remains in an investor-friendly trend.
Cash Flow Statement
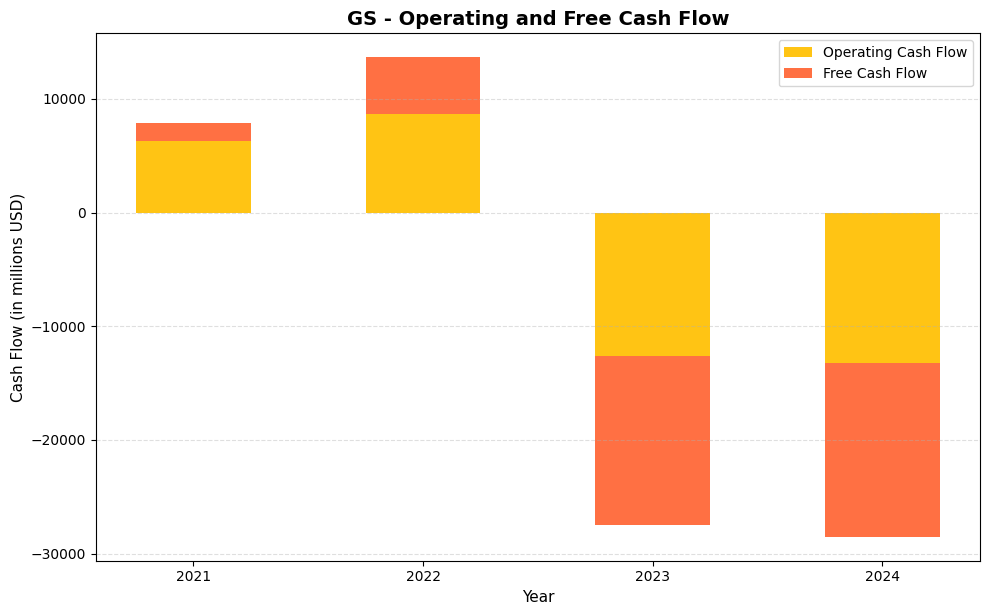
Goldman Sachs presents a cash flow picture that requires careful interpretation for dividend investors. Operating cash flow came in at $6.3 billion in 2021 and expanded to $8.7 billion in 2022, suggesting a business generating meaningful cash from its operations. However, 2023 marked a sharp reversal, with operating cash flow swinging to negative $12.6 billion, and 2024 deepened that trend to negative $13.2 billion. Free cash flow followed the same arc, moving from a positive $5.0 billion in 2022 to negative $14.9 billion in 2023 and negative $15.3 billion in 2024. For a traditional industrial or consumer staples company, figures like these would raise serious red flags about dividend sustainability, but Goldman Sachs operates as a diversified financial institution where operating cash flow is heavily influenced by changes in trading assets, loans originated for sale, and other working capital items that fluctuate dramatically with business volumes and market conditions.
The shift from consistently positive to deeply negative cash flow readings between 2022 and 2023 reflects Goldman’s expansion of its balance sheet activities rather than a deterioration in underlying earnings power. Goldman funds its dividend from net earnings and available liquidity, not solely from what traditional cash flow statements report, which means the free cash flow figures shown here are not directly analogous to dividend coverage metrics used for non-financial companies. The firm generated approximately $8.5 billion in net earnings in 2024 and maintained its pattern of returning capital through both dividends and share repurchases. Shareholders should evaluate Goldman’s dividend sustainability through its earnings payout ratio, regulatory capital ratios, and stress test results rather than through the free cash flow lens that works well for other sectors. On those measures, Goldman’s dividend, currently yielding around 2.1% with a conservative payout ratio relative to earnings, remains on solid footing.
Analyst Ratings
The analyst community’s view on Goldman Sachs heading into early 2026 is best described as constructively cautious. The consensus rating across 20 covering analysts sits at “Hold,” with a mean price target of $959.20. That target implies modest upside of roughly 6% from the current price of $902.27, which is a reasonable reflection of a stock that has already posted exceptional gains over the past year. The range of targets is wide, spanning from a low of $700.00 to a high of $1,125.00, underscoring the degree to which Goldman’s earnings outlook depends on conditions in capital markets, trading volumes, and deal activity that are inherently difficult to forecast with precision.
Analysts who are more bullish point to the firm’s dominant position in equities trading, the recovery in investment banking, and the continued expansion of asset and wealth management as drivers that could push earnings per share materially higher. Those closer to the low end of the target range cite valuation as the primary concern, with the stock trading at a price-to-book ratio of 2.52, a meaningful premium to its historical average and to some peers in the large bank universe. At a trailing P/E of 17.39, Goldman is no longer the undervalued cyclical it appeared to be when shares were trading near $440 a year ago. The consensus, by holding at “Hold,” essentially reflects a view that the stock is fairly priced for its current earnings power, with upside dependent on either a reacceleration in deal activity or a further expansion in trading revenues.
Earning Report Summary
Goldman Sachs delivered strong full-year results for 2025, with revenue reaching $59.4 billion and net income of $16.3 billion, translating to earnings per share of $51.88. These figures represent a meaningful improvement from the prior year and reflect a firm that successfully navigated a complex environment characterized by shifting interest rate expectations, recovering capital markets, and elevated trading volumes driven by macro uncertainty. The return on equity of 13.88% for the full year exceeded what many analysts had projected entering 2025, and the profit margin of nearly 29% confirms that Goldman’s operating leverage remains intact.
Trading Continues to Lead
Goldman’s Global Banking and Markets division remained the primary engine of growth throughout 2025. Equities trading in particular stood out, building on the record quarter posted in early 2025 and sustaining elevated activity levels as investors repositioned around interest rate, geopolitical, and policy developments. Fixed income, currencies, and commodities also contributed meaningfully, benefiting from the same volatility that drove equity volumes. Together, these businesses generated a substantial portion of the firm’s total revenue and provided the earnings stability that allowed management to confidently raise the quarterly dividend by 33% in August.
Investment Banking Recovery
Investment banking fees, which had been a drag on results in early 2025 due to client hesitation around deal timing, showed improvement in the back half of the year. Advisory revenues recovered as economic clarity improved and corporate executives grew more willing to pursue transactions. Debt and equity underwriting also contributed positively as issuance windows opened. CEO David Solomon noted that the deal pipeline had been building for several consecutive quarters, and the conversion of that backlog into completed transactions became more evident in the firm’s second-half performance. The recovery in banking fees, combined with sustained trading strength, produced the strong full-year earnings outcome.
Capital Allocation and Outlook
Goldman continued executing against its $40 billion share repurchase authorization throughout 2025, reducing the share count and providing additional support to per-share earnings growth. The dividend increase to $4.00 quarterly was the most visible capital return decision of the year and was received positively by the market as a sign of management confidence. Looking into 2026, Goldman’s leadership has expressed measured optimism, pointing to a more constructive environment for deal activity, ongoing strength in trading, and continued growth in asset and wealth management as the primary drivers of earnings. The firm’s ability to grow earnings per share while simultaneously expanding its dividend and reducing its share count remains one of the more compelling aspects of the investment case.
Management Team
Goldman Sachs continues to operate under the leadership of David Solomon as Chairman and CEO and John Waldron as President and COO. Both executives received five-year retention packages in 2025 valued at approximately $80 million each, a commitment from the board that reflects confidence in the current strategic direction and a desire to maintain continuity at the top during a period of significant market and competitive change. Waldron’s seat on the Board of Directors further cements his role in shaping Goldman’s long-term trajectory, and the two have worked in close alignment on both capital allocation decisions and the firm’s broader transformation agenda.
The management committee has been strengthened across key revenue-generating divisions. Matt McClure, Anthony Gutman, and Kim Posnett serve as Global Co-Heads of Investment Banking, bringing deep relationships and deal experience to a business that is expected to be a more meaningful contributor to earnings in 2026. The Fixed Income, Currency, and Commodities division is led by Jason Brauth, Kunal Shah, and Anshul Sehgal, while the Equities team operates under Dmitri Potishko, Cyril Goddeeris, and Erdit Hoxha. CIO Marco Argenti continues to lead the firm’s technology and artificial intelligence initiatives, an area that Goldman views as central to its ability to operate more efficiently, serve clients more effectively, and maintain its competitive edge in an increasingly technology-driven financial services landscape.
Valuation and Stock Performance
Goldman Sachs shares trade at $902.27 as of February 24, 2026, putting the stock within striking distance of its 52-week high of $984.70 and well above its 52-week low of $439.38. That range tells the story of a dramatic rerating over the past year, driven by strong earnings, the recovery in capital markets, and renewed investor appetite for financial sector exposure. The trailing P/E ratio of 17.39 is higher than where Goldman has historically traded, reflecting both the improved earnings quality and the market’s willingness to assign a higher multiple to a more diversified and profitable institution than it was a few years ago.
The price-to-book ratio of 2.52 is the metric that gives some analysts pause. At a book value per share of $357.46, the stock is trading at a meaningful premium to its tangible assets, which is a departure from the sub-2x price-to-book ratios that characterized Goldman’s valuation through much of 2023 and early 2024. Bulls argue that this premium is justified by the firm’s return on equity of 13.88%, which exceeds its cost of capital and supports a multiple above book. Bears contend that at $902, much of the good news is already priced in. The consensus price target of $959.20 suggests the analyst community sees a path to further gains but not an urgent one. For dividend investors, the current yield of 1.57% on an $18.00 annual payout reflects a stock that has appreciated faster than the dividend has grown, compressing the yield, though the absolute income generated per share continues to rise.
Risks and Considerations
Goldman’s revenue mix remains heavily dependent on trading and capital markets activity, both of which are inherently cyclical and sensitive to changes in market volatility, interest rates, and investor sentiment. A prolonged period of low volatility or reduced client trading volumes could meaningfully compress revenues from the equities and fixed income businesses that have been the primary drivers of recent earnings growth. The firm’s ability to sustain a P/E ratio above 17 depends in part on the market continuing to believe that current trading conditions are structural rather than cyclical, a belief that may not survive a significant shift in the macro environment.
The stock’s valuation itself represents a consideration for new investors. At a price-to-book ratio of 2.52 and a share price near $902, Goldman is priced for continued strong performance with limited margin for error. Any disappointment in investment banking recovery, trading revenues, or asset management flows could result in a rapid multiple contraction, given that the stock has already priced in a substantial improvement from where it traded a year ago. The 52-week low of $439.38 serves as a reminder of how quickly sentiment can shift in financial stocks.
Goldman also operates with the leverage inherent to investment banking, which amplifies both gains and losses across the balance sheet. While the firm’s risk management capabilities are well-regarded, significant credit market disruptions, counterparty failures, or a sharp deterioration in the broader economy would stress the balance sheet more quickly than it would for a traditional commercial bank. Regulatory capital requirements continue to evolve, and any tightening of requirements at the federal level could constrain Goldman’s ability to deploy capital as freely as it has in recent years, potentially limiting buybacks or slowing dividend growth. International exposure across trading, advisory, and asset management also introduces geopolitical and currency risk that is difficult to fully hedge or predict.
Final Thoughts
Goldman Sachs enters 2026 in a position of meaningful financial strength, with earnings per share of $51.88, a return on equity approaching 14%, and a quarterly dividend that has grown to $4.00 per share. The firm has demonstrated that it can generate substantial profits across different market environments, and the management team has used that earnings power to reward shareholders through both an accelerated dividend and an active buyback program. The 33% increase in the quarterly dividend announced in mid-2025 was a particularly strong signal, and the payout ratio of just over 27% ensures there is ample room for further growth without straining the business.
The primary caution for prospective investors is valuation. Goldman at $902 is a very different investment than Goldman at $440, and the stock’s premium to book value requires continued execution at a high level to justify. For income investors already holding the stock, the growing dividend and ongoing buyback activity remain compelling reasons to stay patient. For those considering a new position, the risk-reward at current prices is more nuanced, and a pullback toward the $800 range or below would represent a more attractive entry point from both a yield and valuation perspective. The business itself is as strong as it has been in years. The question is simply what price reflects that strength fairly.