

Key Takeaways
💰 Fulton Financial offers a forward dividend yield of 3.43% with a conservative 35% payout ratio, supported by consistent dividend growth and a quarterly payment that recently stepped up to $0.19 per share.
📈 The bank generated $381 million in net income over the trailing twelve months with earnings per share of $2.08, reinforcing the sustainability and continued growth of its dividend.
📊 Four analysts covering the stock carry an average 12-month price target of $22.75, suggesting modest upside from the current price of $21.17 as Fulton continues to execute with discipline.
Updated 2/24/26
Fulton Financial Corporation (FULT), a regional bank based in Pennsylvania, continues to stand out for its consistent dividend performance, conservative management, and solid financial footing. With over 200 branches across the Mid-Atlantic and a legacy rooted in community banking, Fulton has maintained a disciplined approach to balance sheet management and shareholder returns. Its current dividend yield of 3.43%, paired with a payout ratio just above 35%, positions it as a reliable income generator supported by stable earnings and growing per-share profitability.
Recent results reflect meaningful operational progress, with net income climbing to $381 million and EPS reaching $2.08 on a trailing basis. The stock trades at approximately 10.2x earnings with a price-to-book ratio of 1.15, offering a reasonable valuation for a regional bank generating an 11.71% return on equity. Management has expressed confidence in the bank’s trajectory, citing disciplined cost management, steady deposit activity, and a focus on long-term shareholder value. For income-focused investors, Fulton presents a stable profile with manageable risks and steady execution.
🧮 Key Dividend Metrics
📈 Dividend Yield: 3.43% (Forward)
💰 Annual Dividend: $0.76 per share
📆 Dividend Growth: Raised to $0.19/quarter in Q4 2025
📊 Payout Ratio: 35.10%
🛡️ Earnings Coverage: EPS of $2.08 (ttm)
📅 Most Recent Dividend: $0.19 (December 31, 2025)
🔄 Dividend Frequency: Quarterly
Recent Events
Fulton Financial closed out 2025 with a notable dividend increase, lifting its quarterly payment from $0.18 to $0.19 per share for the December 31 distribution. That brings the annualized dividend to $0.76, representing a steady cadence of raises that has now seen the quarterly payout grow from $0.15 in early 2023 to its current level over roughly three years. The increase reflects management’s confidence in the earnings power of the franchise and its willingness to share that improvement with shareholders on a consistent basis.
On the earnings front, Fulton has continued to demonstrate meaningful improvement in profitability. Full-year net income reached approximately $381 million, and EPS came in at $2.08, a substantial step up from the $1.70 reported in the prior period. That improvement has been driven by a combination of higher revenue, now running at $1.28 billion on a trailing basis, and continued discipline on the expense side. Return on equity has moved up to 11.71% and return on assets reached 1.22%, both solid readings for a regional bank of Fulton’s size and profile.
The stock has traded between $14.33 and $22.99 over the past year and currently sits at $21.17, placing it in the upper portion of that range. The bank’s book value per share stands at $18.33, meaning shares now trade at a modest premium to book, a shift from where Fulton was priced in earlier periods. That re-rating reflects genuine improvement in the underlying business rather than speculative enthusiasm, and it aligns with a broader trend of investors warming up to well-run regional banks as the rate environment has stabilized.
Dividend Overview
Fulton’s dividend remains one of the more attractive features of the stock for income-oriented investors. The forward yield of 3.43% is not the highest available in the regional banking space, but it comes packaged with a payout ratio of just 35%, leaving substantial room for continued growth and providing a wide cushion against any earnings pressure that might emerge. Investors aren’t stretching for yield here and accepting elevated risk in exchange. The income profile is genuinely well-supported.
What stands out in the dividend history is the deliberate, step-by-step pattern of increases Fulton has delivered. Starting at $0.15 per quarter in early 2023, the payment moved to $0.16, then $0.17, then $0.18, and now $0.19, each increase small but consistent. That cadence communicates something important about how management thinks about the dividend, treating it as a commitment to shareholders that should grow alongside earnings rather than a residual payment made when convenient.
Dividends are paid quarterly, and the most recent payment of $0.19 per share was distributed on December 31, 2025. The rhythm has been maintained without interruption, which is exactly the kind of reliability that retirement portfolios and income-focused strategies are built around. With EPS running at $2.08 against a $0.76 annual dividend, the math on coverage is clear and comfortable.
Dividend Growth and Safety
The dividend growth story at Fulton is one of steady accumulation rather than dramatic announcements. From $0.15 per quarter in early 2023 to $0.19 today, the quarterly payout has grown by roughly 27% over that span. That works out to an annualized growth rate that meaningfully outpaces inflation, even if the individual increments look modest in isolation. Investors who have held the stock through this period have seen real purchasing power improvement in their income stream.
The safety characteristics of the dividend are equally compelling. With a payout ratio of just 35.10% and EPS of $2.08, Fulton would need to see earnings fall by nearly two-thirds before the dividend came under any mathematical pressure. That is an extremely wide margin of safety by any standard, and it reflects the dramatic improvement in the bank’s earnings power relative to where the dividend currently sits. Management has clearly chosen to grow the payout at a measured pace rather than ratchet it up to match the full earnings improvement, which actually enhances long-term safety.
From a volatility standpoint, Fulton continues to offer a smoother ride than most equity investments. The stock’s beta of 0.86 indicates meaningfully less sensitivity to broad market swings, a characteristic that pairs well with the income objective. The 52-week range of $14.33 to $22.99 shows the stock is capable of moving, but the direction over the past year has generally been positive, and the underlying earnings trajectory supports further stability.
Chart Analysis
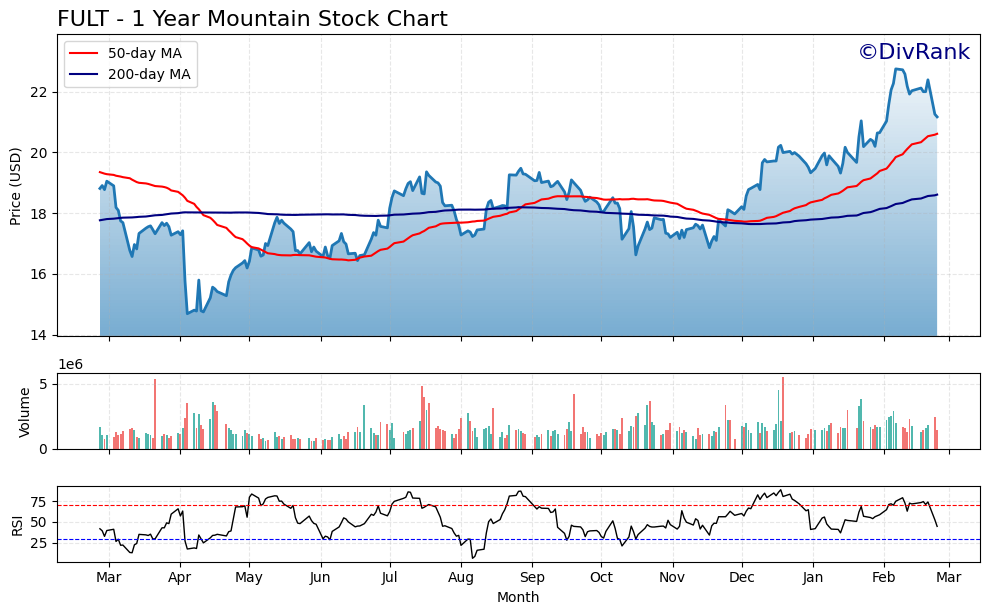
Fulton Financial’s chart tells a compelling recovery story over the past twelve months. The stock bottomed near $14.69 at its 52-week low and has since climbed approximately 44% to its current price of $21.17, a move that reflects a meaningful rehabilitation of investor confidence in regional bank fundamentals. The stock reached a 52-week high of $22.75 earlier in the cycle, and at the current price it sits just under 7% below that peak, which is a relatively modest pullback considering the magnitude of the overall advance. The broader trend from trough to present is clearly constructive, and the price structure suggests a stock that has transitioned from a distressed discount to something closer to fair recognition.
The moving average picture reinforces that bullish read. Fulton is trading above both its 50-day moving average of $20.61 and its 200-day moving average of $18.61, and crucially, the 50-day has crossed above the 200-day to form what technicians call a golden cross. This configuration is generally interpreted as a medium-term bullish signal, indicating that recent price momentum has outpaced the longer-term trend rather than simply reverting to it. The roughly $2.56 spread between the two moving averages gives the golden cross some meaningful distance, suggesting this is not a shallow or fragile crossover that could easily reverse on a few down days.
The RSI reading of 44.64 introduces some nuance into an otherwise positive technical picture. At that level, momentum is neither overbought nor oversold, sitting in neutral territory that leans slightly toward the softer side of the midpoint. For investors who chased the stock higher during its recovery rally, this reading suggests some of that enthusiasm has faded. The pullback from the $22.75 high appears to have worked off any near-term excess without breaking the underlying trend, which is actually a reasonably healthy outcome. A stock consolidating near recent highs with RSI in the mid-40s has more room to re-accelerate than one that remains elevated after a long run.
For dividend investors, the technical setup is encouraging without demanding urgency. The trend is intact, the stock is holding above key moving averages, and the modest distance from the 52-week high suggests the market is not yet pricing in a dramatic reversal. Income-focused buyers watching for a lower-risk entry have a relatively defined reference point around the 50-day moving average near $20.61, which could serve as a natural area of support if near-term softness continues. The overall chart structure is consistent with a stock that dividend investors can monitor with reasonable confidence in the underlying direction, while staying mindful that regional bank names can move sharply on macro and rate-sensitive news.
Cash Flow Statement
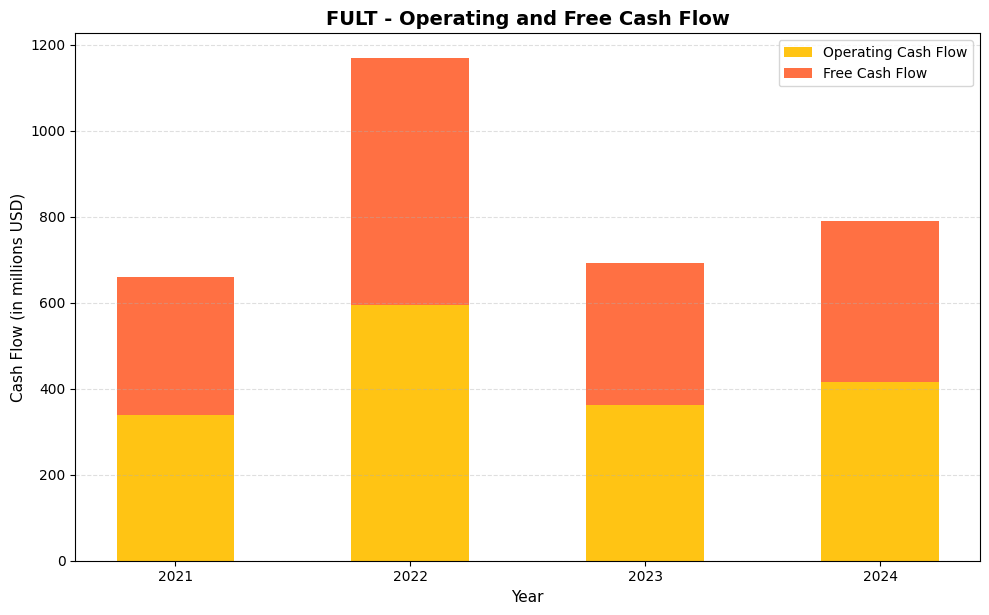
Fulton Financial’s operating cash flow has followed an uneven but ultimately constructive path over the four-year period, moving from $338.4 million in 2021 to a notably elevated $594.8 million in 2022 before settling back to $363.0 million in 2023 and recovering modestly to $416.6 million in 2024. Free cash flow tracked that same pattern closely, landing at $374.1 million in 2024 after a trough of $330.0 million in 2023. For dividend sustainability purposes, what matters most is that free cash flow has remained comfortably above the level required to fund Fulton’s annual dividend obligations in every year shown, providing a reasonable margin of safety even in the softer cash generation years. The 2022 spike stands out as an outlier tied to working capital timing within the banking business rather than a new structural baseline, so investors should anchor their expectations closer to the $330 million to $420 million range as the more representative run rate.
Viewed across the full four-year arc, Fulton’s capital efficiency profile is solid for a regional bank of its size, with capital expenditures consuming only a modest slice of operating cash flow in each period, as evidenced by the consistently tight spread between operating and free cash flow figures. The largest gap between the two measures appeared in 2024, at roughly $42.5 million, which is not alarming given the bank’s ongoing investments in technology and branch infrastructure following its acquisition activity. Shareholders can take some comfort in the fact that the 2024 free cash flow of $374.1 million represents a meaningful improvement over the 2023 figure, suggesting the business is regaining its cash generation footing after a period of integration-related pressure. As long as free cash flow continues trending back toward and above the 2022 high watermark over the coming years, the dividend growth story at Fulton remains on reasonably firm financial ground.
Analyst Ratings
Four analysts currently cover Fulton Financial, and while no formal consensus rating is assigned in the current data, the price target distribution offers a reasonable picture of where the Street stands. The average 12-month price target sits at $22.75, with estimates ranging from a low of $22.00 to a high of $24.00. Against the current share price of $21.17, that average target implies upside of approximately 7.5%, which is a modest but positive signal from a group that tends to be measured in its expectations for community and regional bank names.
The tight clustering of price targets between $22.00 and $24.00 is itself informative. It suggests that analysts covering the stock are largely aligned in their view of fair value, with no significant outliers pulling the range in either direction. That kind of consensus around a narrow band typically reflects a well-understood business with predictable earnings rather than a company facing wide uncertainty about its trajectory. For Fulton, which has consistently delivered on its operational commitments, that alignment feels appropriate. With the stock currently trading below all four price targets, the analyst community collectively sees the current price as an entry point offering at least some margin to fair value, even if the upside is not dramatic.
Earning Report Summary
Earnings Power Has Stepped Up Meaningfully
Fulton Financial’s trailing twelve-month results show a business that has made genuine strides in profitability. Full-year EPS of $2.08 represents a significant improvement from the $1.70 reported in the prior period, and net income of $381 million reflects both revenue growth and continued expense discipline. Total revenue reached $1.28 billion over the trailing period, and the profit margin of 30.66% demonstrates that the bank is converting a meaningful share of that revenue into earnings available for reinvestment and shareholder returns.
Returns on Capital Have Improved
Return on equity of 11.71% and return on assets of 1.22% are both readings that place Fulton in favorable company among regional banks of similar scale. The ROA figure in particular is worth highlighting, as crossing above 1.20% reflects the kind of asset utilization efficiency that separates well-managed banks from average ones. Book value per share has grown to $18.33, and with the stock currently trading at 1.15x book, the market is now assigning a modest premium to Fulton’s tangible assets, a shift from the sub-book valuations that characterized the stock in earlier periods. That re-rating is consistent with the improving earnings trajectory.
CEO Outlook and Capital Position
CEO Curtis Myers has maintained a tone of measured confidence, emphasizing the bank’s operational discipline and long-term focus as key pillars of its strategy. The combination of a 35% payout ratio and improving earnings per share gives the management team considerable flexibility heading into 2026, whether that means additional dividend increases, reinvestment in the franchise, or capital return through other means. The bank’s capital ratios remain strong, providing a buffer against economic uncertainty and supporting the case for continued steady shareholder returns. Overall, Fulton enters 2026 from a stronger earnings foundation than it has seen in recent years.
Management Team
Fulton Financial’s leadership team reflects a steady, no-nonsense approach. At the top is CEO Curtis J. Myers, who has been with the company for decades and clearly understands the markets Fulton operates in. His background in community banking and commercial services brings a practical focus that has been evident in how the company operates day to day. Under his leadership, Fulton has prioritized stability, consistency, and long-term value creation rather than chasing short-term gains, a philosophy that is visible in everything from the dividend cadence to the bank’s approach to credit risk.
The executive team shares that same approach. The CFO and other senior leaders are focused on maintaining cost discipline, preserving asset quality, and keeping the bank’s capital position strong. Their measured tone and commitment to steady execution have helped Fulton navigate rising interest rates, competitive pressure, and integration efforts with minimal disruption. This is not a team trying to reinvent the wheel. They are sticking to what works and refining it over time. For investors who appreciate reliability and income stability, that leadership style goes a long way, and the improving returns on equity and assets suggest the team is executing that philosophy with increasing effectiveness.
Valuation and Stock Performance
Fulton Financial’s stock has traded between $14.33 and $22.99 over the past year, and at its current price of $21.17, it sits well above the midpoint of that range and closer to recent highs. The stock has re-rated meaningfully as earnings have improved, and investors who owned shares near the lower end of the 52-week range have benefited from both price appreciation and a growing dividend stream. At current levels, the entry yield has moderated relative to what was available at lower prices, but the income profile remains attractive on an absolute basis.
From a valuation perspective, Fulton trades at 10.18x trailing earnings, a modest multiple that reflects neither a deep value discount nor a growth premium. The price-to-book ratio of 1.15 represents a shift from the sub-book trading that characterized the stock in prior periods, and it suggests the market has begun to recognize the improved earnings power the bank has demonstrated. For a regional bank generating 11.71% return on equity, a slight premium to book is a reasonable outcome rather than a sign of overvaluation.
The dividend yield of 3.43% sits modestly below the five-year historical average yield, which is partly a function of the stock’s price appreciation over the past year rather than a reduction in the dividend itself. In fact, the dividend has grown throughout this period. The beta of 0.86 continues to mark Fulton as a below-average volatility holding, making it a suitable anchor for income-oriented portfolios that prioritize consistency over the potential for large price swings. Analysts see an average price target of $22.75, implying further upside from current levels even after the stock’s recent strength.
Risks and Considerations
Interest rate sensitivity remains the most significant structural risk for Fulton’s earnings profile. The bank’s net interest income, which drives the majority of its revenue, is directly influenced by the shape of the yield curve and the direction of short-term rates. The current environment has been broadly supportive, contributing to the improvement in margins and profitability over the past year. A reversal, whether through rate cuts that compress loan yields faster than deposit costs decline, or a flattening of the curve that narrows the spread between short and long-term rates, could put pressure on net interest income and slow the earnings momentum that has supported recent dividend growth.
Credit quality is always a key variable for a regional bank, and while Fulton’s loan book has performed well in recent periods, the trajectory of the broader economy will play a meaningful role in whether those conditions persist. Regional banks tend to have concentrated exposure to local and mid-sized commercial borrowers, and a softening in business conditions across the Mid-Atlantic markets Fulton serves could lead to higher charge-offs and loan loss provisions that weigh on earnings. The current reserve position provides some cushion, but credit cycles can shift more quickly than income statements reflect.
Competitive dynamics in regional banking continue to intensify. Larger national banks with greater technology investment capacity and lower funding costs compete directly for the same deposits and borrowers that Fulton relies on, while fintech firms have made inroads in lending and payments products that community-oriented banks have historically owned. Fulton’s response to these pressures requires ongoing technology investment that adds to the expense base, and the outcomes of that spending are not always immediately visible in financial results.
Finally, the dividend, while currently very well covered at a 35% payout ratio, is ultimately dependent on earnings continuity. If a combination of the risks above were to materialize simultaneously, net income could compress enough to prompt management to reconsider the pace of dividend growth, even if an outright cut remained unlikely given the current coverage levels. Investors should monitor the earnings trajectory and payout ratio each quarter to ensure the safety metrics remain intact.
Final Thoughts
Fulton Financial doesn’t aim to be the fastest-growing bank in the sector, and that’s part of its appeal. It delivers dependable income, managed risk, and a leadership team that knows how to navigate through both growth periods and slowdowns. The improvement in EPS from $1.70 to $2.08, alongside the dividend’s climb from $0.15 to $0.19 per quarter, tells the story of a bank that has quietly compounded value for its shareholders over the past few years without drawing much fanfare.
For dividend investors, the combination of a 35% payout ratio, $2.08 in EPS, and a consistent history of quarterly increases makes the income stream look durable and likely to grow further. The bank is not over-earning or taking on excess risk to support the payout. It is simply generating more from its core operations and passing a measured portion of that improvement along to shareholders, which is exactly the kind of dividend policy that holds up well across economic cycles.
At $21.17, the stock trades at a reasonable 10.18x earnings and a slight premium to book value that reflects genuine business improvement. Analysts see an average fair value of $22.75, suggesting the re-rating has room to continue even if the pace is likely to be gradual. The 3.43% yield may be lower than what was on offer when the stock was trading near its 52-week lows, but the underlying quality of the dividend has improved alongside the price, which is a more sustainable path to total return.
For portfolios focused on income and stability, Fulton Financial brings a mix of tradition, discipline, and quiet performance that fits well. It may not grab headlines, but it keeps delivering, and that’s exactly what many long-term investors are looking for.