

Key Takeaways
💰 LLY offers a forward dividend yield of 0.67% with a consistent history of growth and a payout ratio of 44%, providing steady income with room for future increases.
💵 Operating cash flow reached $8.8 billion TTM, while free cash flow remained positive despite high capital expenditures, reflecting strong internal funding capacity.
📊 The consensus analyst price target is around $1,000.32, with mixed sentiment after a recent downgrade due to valuation concerns despite strong product performance.
📈 Quarterly revenue surged 45% year-over-year to $12.73 billion, driven by high demand for key drugs, though full-year earnings guidance was revised slightly lower.
Last Update: 5/1/25
Eli Lilly (LLY) has emerged as a dominant force in the pharmaceutical industry, backed by breakthrough growth in diabetes and obesity treatments. Its blockbuster drugs Mounjaro and Zepbound have fueled a 45% jump in quarterly revenue, pushing the company’s stock near all-time highs and attracting significant investor attention. The management team has kept pace with demand through strategic manufacturing expansions and disciplined capital planning, all while supporting a consistent dividend.
While the yield is modest, Lilly’s payout is firmly supported by earnings strength and cash flow generation. A robust pipeline, market-leading therapies, and a long-term focus have positioned the company for sustained performance.
Recent Events
Earnings dropped this morning, and the initial reaction from the market wasn’t exactly celebratory. Shares slipped over 4% in pre-market despite a solid performance in the first quarter. The company beat expectations with earnings per share coming in at $3.46—a strong 34% increase from last year. Sales were up as well, surging nearly 45% from a year ago. These numbers tell you the business is humming.
But it wasn’t all sunshine. Management adjusted its profit guidance for the rest of the year, which dampened some of the enthusiasm. That’s not uncommon in a high-growth business pouring cash into new capacity and R&D. And when a stock like LLY has been on a monster run, expectations are sky-high.
Still, if you zoom out, there’s no mistaking the direction. Revenue is accelerating, margins remain strong, and the engine behind future growth—drugs like Mounjaro and the Alzheimer’s pipeline—is alive and well. For dividend investors, what matters most is that the company continues to generate the kind of cash flow that supports steady, reliable payouts.
Key Dividend Metrics
💰 Forward Dividend Yield: 0.67%
📈 Annual Dividend Rate: $6.00
📆 Most Recent Dividend Date: March 10, 2025
📊 Payout Ratio: 44.41%
📉 5-Year Average Yield: 1.13%
📈 Dividend Growth Trend: Upward, but modest
📌 Next Likely Declaration: Summer 2025
Dividend Overview
Let’s be real—Lilly isn’t going to catch your eye with its dividend yield. At just under 0.7%, it’s not going to make income investors sprint toward the buy button. But dig a little deeper, and the story gets a lot more interesting.
This is a company with incredible earnings power and a clear focus on balancing growth with shareholder returns. With an operating margin of over 42% and profit margins well above 20%, it has the kind of cash-generating ability that many companies would kill for. And it’s using that cash wisely—not just to fund next-gen therapies, but to consistently raise its dividend.
The current payout ratio hovers around 44%, which leaves plenty of room for reinvestment and future hikes. It’s the kind of steady approach you want in a company navigating the complex world of drug development and regulatory approvals. You’re not getting a high yield here, but you’re getting a dependable, well-supported stream of income from one of the most profitable companies in the sector.
Dividend Growth and Safety
When it comes to dividend safety, Lilly is in a strong position. Free cash flow is solid, even with heavy investments being made into manufacturing and research. Operating cash flow over the last year came in at nearly $9 billion. Even after capital expenses, there’s still over a billion in levered free cash flow.
Debt is on the high side—total debt sits at almost $35 billion, with a debt-to-equity ratio north of 240%. That might raise eyebrows, but it’s manageable in the context of Lilly’s earnings profile and cash generation. The company’s history of disciplined capital allocation gives confidence that dividends won’t be sacrificed for expansion, even as growth opportunities heat up.
And speaking of growth—Lilly has consistently raised its dividend over the past decade. The increases haven’t been flashy, but they’ve been dependable. That fits the company’s overall playbook: steady, deliberate, and always with an eye on the long term.
What’s interesting is the upside. If current drugs continue to scale globally and pipeline developments hit, Lilly could very well increase its dividend growth pace down the road. For now, investors are getting a modest but safe yield with plenty of room to grow.
Lilly doesn’t need to shout to prove its value to dividend investors. The numbers speak for themselves, and the potential for future increases is baked into the company’s strategy. For those with a long view and a taste for steady income paired with long-term capital appreciation, LLY fits the bill.
Cash Flow Statement
Eli Lilly generated $8.8 billion in operating cash flow over the trailing twelve months, more than doubling the prior year’s figure. That’s a significant improvement, largely fueled by higher revenues from key drug sales and margin expansion. However, this surge in cash from operations was almost entirely offset by a major jump in capital expenditures, which climbed to $8.4 billion—reflecting Lilly’s continued investment in manufacturing capacity and R&D infrastructure.
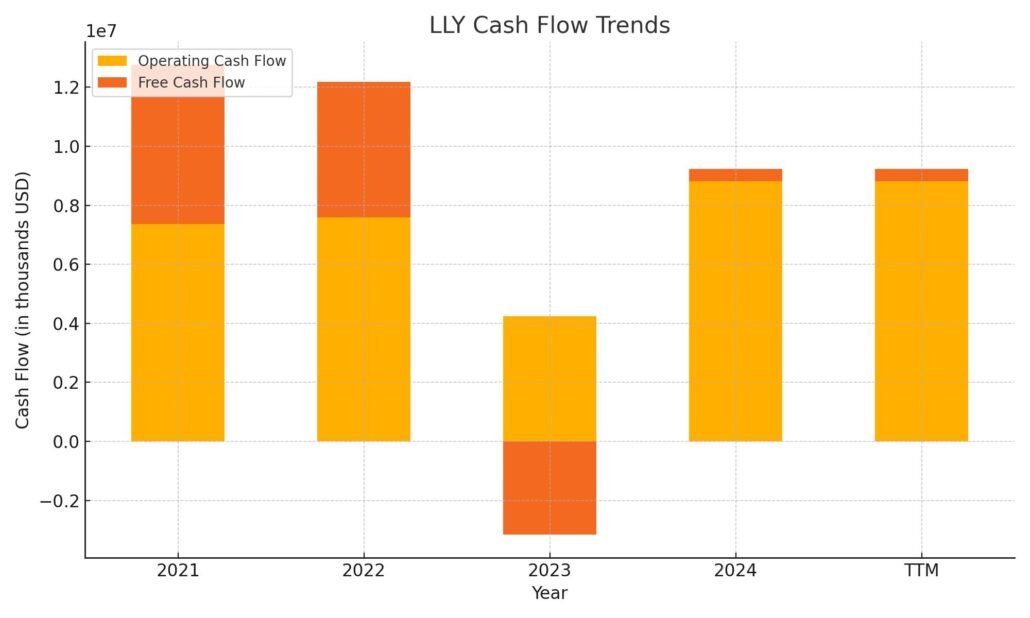
On the financing side, the company issued over $11.4 billion in new debt while repurchasing $2.5 billion in stock and paying down $664 million in debt. This infusion of borrowed capital helped fund its aggressive investment strategy. Despite the heavy outflows from investing activities, Lilly still ended the period with $3.27 billion in cash on hand, slightly up from the previous year. Free cash flow came in modestly positive at $414 million, which is a notable turnaround from last year’s negative number, but still reflects the tight margin between earnings and reinvestment right now.
Analyst Ratings
Eli Lilly has recently seen a shift in analyst sentiment, with one notable downgrade coming from HSBC. The firm moved the rating from Buy to Reduce, primarily due to concerns around stretched valuation and growing competition in the weight-loss drug market. 📉 Alongside the downgrade, HSBC also cut its price target from $1,150 to $700, signaling a more cautious stance on how much room the stock has to run in the near term.
That said, the broader analyst view remains optimistic. The average consensus price target now sits at around $1,000.32, suggesting there’s still upside potential from current levels. 📈 Analysts continue to favor Eli Lilly’s leadership in diabetes and obesity treatments, particularly with the rapid adoption of its GLP-1 therapies. There’s also ongoing enthusiasm for its pipeline, which includes promising candidates in Alzheimer’s and oncology.
The market reaction to recent earnings guidance adjustments may have triggered a pullback, but many analysts believe the long-term thesis remains intact. 🧠 High margins, pipeline depth, and strong demand trends are keeping investor interest alive. While not everyone is in agreement on short-term valuation, the strategic direction continues to earn respect from much of Wall Street.
Earning Report Summary
Big Revenue Gains from Key Drugs
Eli Lilly’s latest earnings release had plenty for investors to take in, especially those tracking the company’s breakout growth in diabetes and weight-loss treatments. The headline number was strong—revenue hit $12.73 billion for the quarter, which is a 45% jump compared to the same time last year. Most of that was thanks to Mounjaro and Zepbound, two drugs that have quickly become major growth engines. Mounjaro alone brought in $3.84 billion, while Zepbound followed with $2.31 billion. Zepbound came in a little lighter than some had expected, largely because the company recently cut prices to make it more accessible to patients.
Strong Earnings, But Guidance Pulled Back
Earnings for the quarter came in well ahead of what analysts were looking for. Reported net income reached $2.76 billion, or $3.06 per share. On an adjusted basis, earnings per share came in at $3.34. That’s a strong performance, but Lilly did lower its full-year adjusted earnings guidance to between $20.78 and $22.28 per share. The change reflects a few headwinds, including some investment losses and a large R&D charge tied to newly acquired programs. It’s a reminder that even with strong top-line momentum, the company is still making heavy investments for long-term growth.
Leadership’s Outlook and What’s Ahead
CEO David Ricks struck a confident tone when discussing the quarter. He pointed to new product launches in areas like oncology and immunology as proof that the pipeline is delivering. He also called attention to positive trial results from orforglipron, an oral version of the GLP-1 class of drugs that could further strengthen Lilly’s position in obesity and diabetes care. That’s a space where the company is clearly playing offense.
To meet the growing global demand, Lilly is also going big on infrastructure. They’re accelerating manufacturing expansion with four new facilities already in motion. It’s a bold but necessary move if they want to keep pace with the skyrocketing demand for these new treatments.
Revenue guidance for the full year was left unchanged, staying in the range of $58 to $61 billion. That shows Lilly still sees strong momentum through the rest of 2025, even as they recalibrate earnings expectations a bit. The takeaway here is that Eli Lilly is in a phase of rapid growth, backed by real demand, and they’re not hesitating to reinvest for what’s coming next.
Chart Analysis
Price Trends and Moving Averages
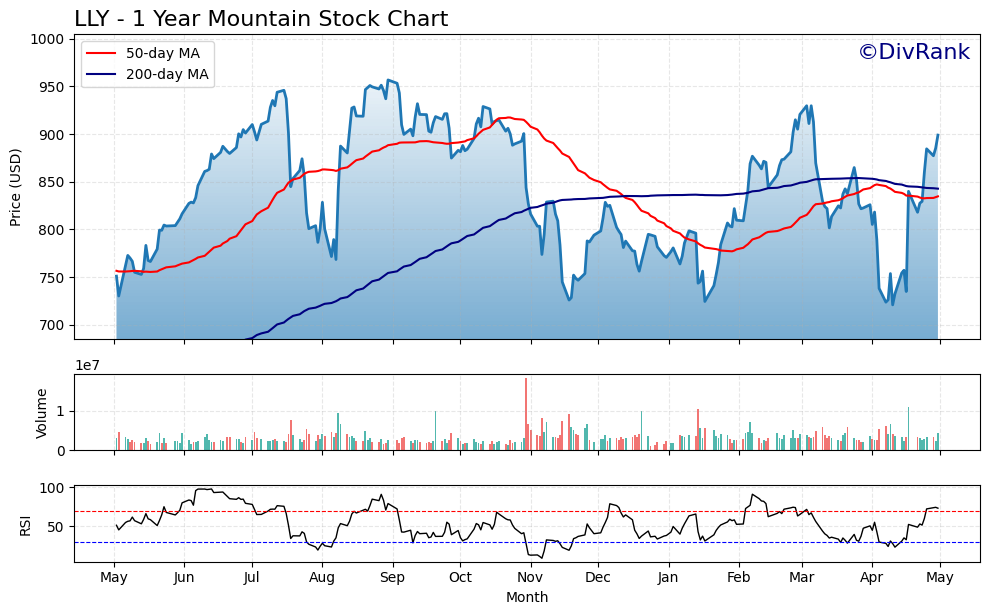
Looking at the chart for LLY, the price action over the past year has been a mix of strong rallies and healthy corrections. The 50-day moving average (in red) shows a sharp climb from mid-May through August, tracking the stock’s momentum as it surged from around $750 to over $950. That was followed by a classic rollover, where the short-term trend softened and started trailing below the 200-day moving average (in blue) heading into late 2023.
Since then, the price has been bouncing between support in the $750–$800 zone and resistance around the $900–$950 level. What’s interesting now is how the 50-day moving average has started to curl upward again, approaching the 200-day line from below. This kind of crossover setup often hints at a potential trend reversal, especially if volume confirms the move.
Volume and Market Participation
Volume has been relatively stable, with a few spikes during key dips and rebounds. This suggests institutional support is still present, especially during the more aggressive sell-offs and rallies. The absence of heavy sustained selling tells you the conviction from long-term holders hasn’t really been shaken, even through volatility.
Relative Strength Index (RSI)
The RSI at the bottom of the chart gives more insight. For a big portion of the year, it hovered below the midpoint, especially during the long consolidation from October through February. But the recent move higher pushed RSI above 70, signaling short-term overbought conditions. That doesn’t necessarily mean a pullback is coming, but it does show how strong the recent surge has been.
Overall, the chart shows a stock that’s been through a period of consolidation after a big run, found support multiple times, and is now making another strong attempt to break out. The recent bounce back above both moving averages and the strength in RSI suggest the price is gaining traction again.
Management Team
Eli Lilly’s executive leadership remains one of its quiet strengths. At the helm, CEO David Ricks has guided the company through a pivotal transformation since stepping into the role in 2017. Under his leadership, Lilly has become a global leader in high-impact areas like diabetes, obesity, and neuroscience. Ricks has prioritized long-term investment over short-term earnings beats, a philosophy that’s helped the company build durable advantages in its most lucrative categories.
Chief Financial Officer Anat Ashkenazi continues to play a key role behind the scenes. Her financial strategy has balanced the demands of aggressive R&D spending with prudent cash management. She’s helped maintain a strong balance sheet while the company invests billions into scaling up capacity and funding clinical trials. That financial discipline has been essential in supporting both the dividend and the company’s ambitious growth plans.
The broader leadership team brings a mix of operational depth and scientific expertise. Their focus on developing the pipeline, expanding global reach, and building out infrastructure has laid a strong foundation for sustained growth. It’s a group that operates with clear strategic intent and a long-term view, staying grounded in execution even as investor attention focuses on blockbuster drug headlines.
Valuation and Stock Performance
LLY’s stock has posted substantial gains over the past year, pushing close to $900 after spending time below $750 in early 2023. At its 52-week peak, it briefly touched just under $975. This run-up in price has come alongside explosive revenue growth, particularly from its GLP-1 drugs for diabetes and weight management. Still, those gains have brought the valuation into more demanding territory.
The forward P/E ratio is just under 40, while the trailing P/E stands well above 70. By traditional metrics, that looks expensive. The price-to-sales ratio is now above 18, and price-to-book hovers around 57. But those figures reflect expectations that Lilly will continue to deliver outsized earnings growth from its obesity portfolio and beyond. The company’s margins and return on equity support those high multiples—at least for now.
Over the last five years, LLY has dramatically outperformed the broader healthcare sector and the S&P 500. Pullbacks have been relatively short-lived and often followed by renewed buying interest. The technical picture shows a stock that tends to hold support and recover on strength, which suggests continued confidence from long-term investors.
This performance hasn’t just been about hype. It’s rooted in financial results, product traction, and a vision that’s resonating across investor types. While the current price reflects high expectations, it also reflects the company’s position as a dominant force in multiple therapeutic areas.
Risks and Considerations
Even the strongest companies face challenges, and Lilly is no exception. The most immediate risk is rising competition in the GLP-1 space. With other pharmaceutical giants racing to introduce their own obesity and diabetes treatments, the lead Lilly currently holds may narrow. If a rival drug proves more effective or easier to administer, market share could shift faster than anticipated.
Regulatory uncertainty is another factor. Drug pricing remains a key issue in U.S. policy debates, and with Lilly’s therapies drawing increased attention, future legislative or administrative changes could impact pricing power or margins. Any move toward price caps or reimbursement limitations would hit revenue projections directly.
There’s also execution risk tied to manufacturing expansion. The company is investing heavily in new production facilities to meet growing demand, but those projects are complex and capital-intensive. Delays or unexpected costs could impact timelines and strain free cash flow, which is already thin due to high capital spending.
Additionally, Lilly’s strong earnings are currently driven by a concentrated set of products. If one or more of those growth drivers were to face a slowdown—whether due to market dynamics, regulatory delays, or safety concerns—the stock could see a sharp revaluation. The pipeline is promising but still carries risk, as most late-stage programs are not yet commercialized.
Final Thoughts
Eli Lilly has carved out a strong position in one of the most competitive sectors in healthcare. It has done so not just by developing market-leading products, but by staying focused on execution, reinvestment, and long-term strategy. The leadership team has shown discipline, balancing shareholder returns with the kind of capital allocation that fuels sustainable growth.
Despite a modest yield, the dividend remains secure and well-supported by earnings and cash flow. For investors looking at companies with room to grow and the ability to reward shareholders along the way, Lilly continues to check a lot of boxes. The balance sheet is healthy, the pipeline has depth, and the commercial portfolio is growing fast.
Still, the company is priced for success. That means continued delivery is not optional—it’s expected. Any slip in execution or a shift in the competitive landscape could weigh heavily on sentiment. But if the company can maintain its pace, meet global demand, and expand into new therapeutic areas, the long-term outlook remains compelling.
This is a business that’s executing on a clear strategy with a strong product engine and capable leadership. As long as that story holds, it’s likely to keep attracting investor attention, even at a premium.