

Key Takeaways
🌿 Dividend yield of 4.18% backed by consistent annual increases and an exceptionally low payout ratio of just 18.37%.
💵 Robust cash generation, with $33.6 billion in operating cash flow providing ample coverage for dividends and buybacks.
📊 Analyst consensus is hold, with a mean price target of $33.01 against a current price of $30.79, implying modest upside.
📈 A P/E ratio of 5.71 places Comcast among the most inexpensively valued large-cap dividend payers in the communication services sector.
👔 Leadership under CEO Brian Roberts continues to balance legacy business pressures with long-term investment in streaming, parks, and broadband infrastructure.
Updated 2/25/26
Comcast Corporation (CMCSA) continues to offer dividend growth investors a compelling combination of yield, safety, and valuation. The stock now yields 4.18% on an annual dividend of $1.32 per share, supported by an impressively low payout ratio of 18.37% and operating cash flow of $33.6 billion over the trailing twelve months. The company raised its quarterly dividend to $0.33 in January 2026, continuing a pattern of steady annual increases that has persisted through the competitive pressures reshaping the media and telecom landscape. At a P/E of just 5.71 and a price-to-book of 1.15, the stock trades at levels that suggest the market is pricing in considerable pessimism, potentially creating an opportunity for patient income investors.
Leadership under CEO Brian Roberts remains focused on navigating the structural decline in legacy cable while investing in growth verticals including Peacock, theme parks, and broadband infrastructure. The stock currently sits at $30.79, well below its 52-week high of $35.60, giving income investors an entry point at a yield meaningfully above the company’s five-year average.
Recent Events
Comcast’s most consequential near-term story heading into 2026 is the anticipated opening of Epic Universe, its massive new theme park in Orlando. The project represents one of the largest capital investments in the company’s history and is expected to open in mid-2025, adding five themed worlds and more than 50 attractions to its parks portfolio. The opening has been a focal point for management commentary, with early indicators suggesting strong advance ticket demand and the potential to meaningfully shift the revenue mix of the NBCUniversal segment over the next several years.
On the streaming front, Peacock has continued to grow its subscriber base, and the platform’s financial losses have been narrowing as the company applies more pricing discipline. Comcast has also been navigating the next phase of its relationship with Charter Communications around their mobile and broadband bundling arrangement, which could influence how effectively Comcast retains and acquires broadband customers against the persistent pressure from fixed wireless alternatives offered by T-Mobile and Verizon. The broader media environment remains in flux, with ongoing discussions in the industry about further consolidation and the evolving economics of sports rights, both areas where Comcast’s NBC and Peacock assets have a direct stake.
📌 Key Dividend Metrics
📈 Forward Yield: 4.18%
💰 Annual Dividend: $1.32 per share
📅 Latest Dividend Payment: $0.33 per share (January 14, 2026)
📉 Payout Ratio: 18.37%
📈 5-Year Average Yield: 2.48%
📊 Dividend Growth: Annual increases sustained across 2023, 2024, 2025, and into 2026
🛡️ Dividend Safety: Very strong, covered more than five times by EPS of $5.39
🪙 Most Recent Ex-Dividend Date: January 8, 2026 (for the $0.3093 payment)
Dividend Overview
At 4.18%, Comcast’s current yield sits well above what the average S&P 500 constituent offers and is notably higher than the company’s own five-year average yield of approximately 2.48%. That gap reflects the meaningful decline in the share price from its highs, which has had the effect of pushing the yield to levels that are genuinely attractive on an absolute basis for income-focused investors. The $1.32 annual dividend is funded many times over by earnings per share of $5.39, producing a payout ratio of just 18.37%, which is among the lowest of any dividend-paying large-cap in the communication services sector.
The most recent dividend payment of $0.33 per share, paid on January 14, 2026, represented a step up from the prior quarterly rate of $0.3093, continuing Comcast’s pattern of annual raises. Management has been deliberate about maintaining a conservative payout ratio, preserving the financial flexibility needed to fund capital-intensive growth projects like Epic Universe while also sustaining an active share repurchase program. At a current price of $30.79 and a price-to-book ratio of just 1.15 against a book value per share of $26.89, Comcast trades close to its tangible asset base, adding another dimension of value for long-term holders.
Dividend Growth and Safety
Comcast’s dividend history over the past three years tells a clear and consistent story. The quarterly payment was $0.2718 through most of 2023, rose to $0.2905 in April 2024, climbed again to $0.3093 in April 2025, and stepped up once more to $0.33 in January 2026. That progression represents cumulative per-share growth of roughly 21.4% over approximately three years, a pace that comfortably outpaces inflation and reflects management’s confidence in the durability of the underlying cash flows.
The safety of that dividend is supported by numbers that leave very little room for concern. Operating cash flow of $33.6 billion for the trailing twelve months dwarfs the approximately $4.8 billion the company pays out annually in dividends at the current rate. Even free cash flow of $5.6 billion, which reflects the heavy capital spending associated with network upgrades and the Epic Universe construction cycle, covers the dividend comfortably. EPS of $5.39 against an annual dividend of $1.32 produces a payout ratio of just 18.37%, meaning Comcast retains more than 80 cents of every dollar it earns after paying shareholders. That kind of coverage is a meaningful buffer against earnings volatility.
Debt remains a feature of Comcast’s balance sheet, as it has been for years, but the company’s cash generation capacity makes the leverage manageable. Return on equity of 21.41% and a profit margin of 16.17% on revenue of nearly $123.7 billion underscore the earnings power of the business. Institutional ownership remains high, reflecting confidence among sophisticated capital allocators in the company’s long-term trajectory. For dividend investors, the combination of a growing payout, a low ratio, and substantial cash flow coverage makes this one of the more reliable income setups in the large-cap universe.
Chart Analysis
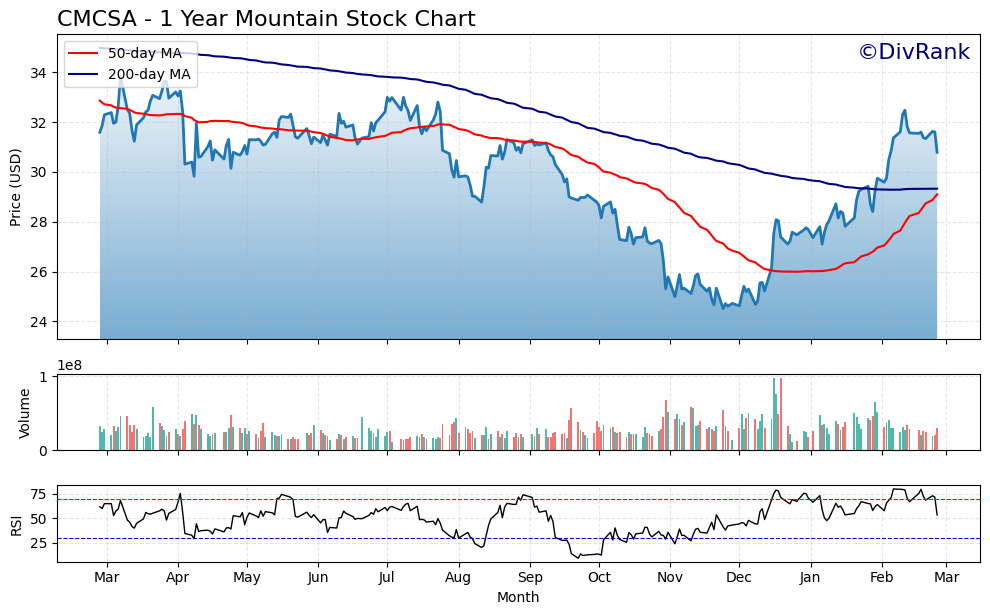
Comcast shares have traced a volatile but ultimately constructive path over the trailing twelve months, carving out a 52-week low of $24.51 before recovering to the current price of $30.79. That recovery of roughly 25.6% off the trough reflects a meaningful shift in sentiment, even if the stock still sits about 9% below its 52-week high of $33.84. The broader price action tells a story of a stock that spent much of the past year under pressure, found a durable floor in the mid-twenties, and has since rebuilt toward a more respectable trading range for income investors watching the entry point.
The moving average picture is mixed but leans cautiously constructive in the near term. Comcast is currently trading at $30.79, which puts it above both its 50-day moving average of $29.10 and its 200-day moving average of $29.33. That dual confirmation is a modest positive signal, suggesting the stock is carrying some momentum relative to its own recent history. The complication is that the 50-day moving average sits below the 200-day, a configuration commonly referred to as a death cross, which reflects the damage done during the earlier selloff and signals that the longer-term trend has not yet fully repaired. Dividend investors should read this as a recovery in progress rather than a fully confirmed uptrend.
The RSI reading of 53.33 lands squarely in neutral territory, neither overbought nor oversold. That kind of middle-ground momentum reading is actually useful context for income-oriented buyers, because it suggests the stock is not being chased by speculative traders and has room to move in either direction without a technical ceiling pressing down on it immediately. There is no sign of exhaustion in the current advance, which keeps the risk of a sharp near-term reversal relatively contained based on this indicator alone.
For dividend investors, the overall technical setup at $30.79 represents a reasonably balanced entry. The stock has recovered substantially from its lows, which compresses the margin of safety somewhat compared to where patient buyers could have added shares earlier in the year, but trading above both key moving averages with a neutral RSI is far more comfortable than buying into a deteriorating trend. The lingering death cross is a yellow flag worth monitoring, and a decisive move back through the 200-day average on the downside would warrant reassessment. For now, the chart supports a measured accumulation posture for investors who are primarily focused on the income stream rather than near-term price appreciation.
Cash Flow Statement
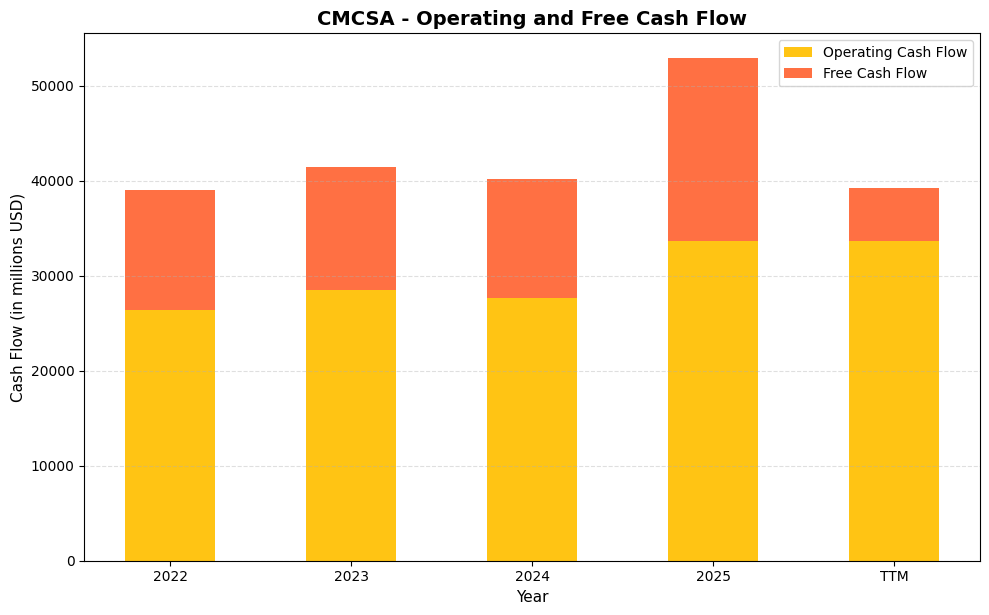
Comcast’s cash generation engine has demonstrated remarkable consistency and, more recently, notable acceleration. Operating cash flow climbed from $26.4 billion in 2022 to $28.5 billion in 2023 before dipping modestly to $27.7 billion in 2024, then surging to $33.6 billion in 2025, a level that matches the reported TTM operating figure. Free cash flow followed a similarly steady path through 2022 to 2024, holding in a tight band between $12.5 billion and $13.0 billion annually, before leaping to $19.2 billion in 2025. That 2025 free cash flow figure is particularly significant for dividend investors because it represents a substantial step-up in the cash available after capital expenditures, giving management far greater flexibility to fund the dividend, execute buybacks, and reduce debt simultaneously. The TTM free cash flow figure of $5.6 billion appears dramatically lower than the full-year 2025 number, which likely reflects the timing of the SpinCo separation of NBCUniversal cable networks and related transaction costs rather than a deterioration in the underlying business.
Stepping back across the full four-year picture, Comcast has generated cumulative operating cash flow well in excess of $100 billion, a testament to the durability of its cable and broadband infrastructure franchise. Capital expenditure intensity has been a central story here: the relatively steady free cash flow of roughly $12.5 billion to $13.0 billion from 2022 through 2024 reflected heavy investment cycles in network expansion and wireless buildout, and the jump to $19.2 billion in 2025 suggests that phase of elevated spending is moderating, converting more of the company’s operating earnings into distributable cash. For dividend growth investors, this trajectory is encouraging because it implies the payout, which consumed a manageable fraction of free cash flow throughout this period, is becoming more conservatively covered rather than less so. The structural shift toward higher-margin connectivity revenue, combined with improving capital efficiency, positions Comcast to sustain and grow its dividend even as the media business undergoes its reorganization.
Analyst Ratings
The analyst community holds a collective hold consensus on Comcast as of February 2026, with 22 analysts contributing to a mean price target of $33.01. At a current price of $30.79, that consensus implies modest upside of roughly 7%, which is a narrower gap than the 34% potential that characterized the analyst view a year ago. The compression in the mean target reflects a recalibration of expectations around broadband subscriber trends and the pace of Peacock’s path to profitability, though the range of targets remains wide, spanning from a low of $23.00 to a high of $44.00.
The $44.00 high target suggests that at least one analyst on the coverage list sees the Epic Universe catalyst and streaming improvement as capable of driving a significant rerating. The $23.00 low, on the other hand, implies that the most bearish voice on the street sees further downside risk if broadband losses accelerate or debt management becomes more challenging. With the stock currently trading below the mean target, the balance of analyst opinion leans in favor of the current price representing fair to slightly discounted value. Investors watching for a catalyst to drive the stock back toward the upper end of the target range will likely be focused on Epic Universe attendance data once the park opens and on any inflection in broadband net additions in coming quarters.
Earning Report Summary
Comcast’s most recent earnings results showed the company continuing to navigate a bifurcated operating environment, where exceptional cash generation from its core connectivity and content businesses runs alongside the ongoing structural headwinds in legacy video and linear television. Revenue of nearly $123.7 billion on a trailing basis reflects the scale of the enterprise, and a net income figure of approximately $20 billion produced EPS of $5.39, which is a strong result that the market’s current P/E of 5.71 appears to significantly discount.
Profitability remains strong despite subscriber pressures
The profit margin of 16.17% and return on equity of 21.41% are metrics that would be considered excellent in almost any industry, and they speak to the durability of Comcast’s earnings even as cord-cutting and broadband competition persist. Operating cash flow growth to $33.6 billion was one of the more constructive data points in the recent financials, demonstrating that the core business is generating more cash than it was a year ago despite the top-line pressures that have concerned investors and contributed to the stock’s decline from its 52-week high of $35.60.
Theme parks and streaming as the forward growth story
Management commentary has centered on Epic Universe as the most significant near-term growth driver for the NBCUniversal segment. The park’s opening is expected to elevate attendance and per-capita spending across the Orlando resort complex. Peacock’s subscriber trajectory and improving loss profile have also been highlighted as evidence that the company’s streaming investment is beginning to show a return. While Peacock is not yet profitable, the narrowing of its cash losses represents meaningful progress toward a breakeven inflection that would reduce the drag on consolidated free cash flow.
Capital allocation reflects confidence in the long-term plan
Management has maintained its commitment to returning capital to shareholders through both dividends and buybacks while simultaneously funding the largest parks investment in the company’s history. The January 2026 dividend increase to $0.33 per quarter was a clear signal that the board views current cash flows as more than adequate to support a growing payout. CEO Brian Roberts has characterized the current period as one of intentional investment ahead of a cash flow expansion phase, a framing that aligns with the free cash flow trajectory expected once Epic Universe’s construction spending normalizes.
Management Team
Comcast’s leadership remains anchored by Brian L. Roberts, who serves as Chairman and CEO and has guided the company through its transformation from a regional cable operator into one of the largest media and technology enterprises in the world. His tenure spans decades and encompasses the acquisitions of NBCUniversal, Sky, and DreamWorks Animation, along with the organic buildout of Peacock and the company’s theme park expansion. Jason S. Armstrong serves as Chief Financial Officer, overseeing the capital allocation strategy that has allowed Comcast to simultaneously invest in Epic Universe, grow its dividend annually, and repurchase shares. Michael J. Cavanagh holds the role of President, contributing broad operational and financial oversight across the enterprise.
David N. Watson leads Comcast Cable as CEO, managing the broadband and connectivity business that remains the financial backbone of the entire organization. Dana Strong continues as Group CEO of Sky, overseeing the European operations that add geographic diversification to Comcast’s revenue base. The management team as a whole brings a combination of institutional knowledge and willingness to make large-scale strategic bets, a balance that has defined Comcast’s approach through multiple industry disruption cycles and that will be central to how the company positions itself as the media and connectivity landscapes continue to evolve.
Valuation and Stock Performance
Comcast shares closed at $30.79, sitting roughly 13.5% below the 52-week high of $35.60 and considerably above the 52-week low of $24.13, suggesting the stock has found some support after a difficult stretch. The market cap stands at approximately $112.2 billion, and the valuation metrics at this price are striking. A P/E ratio of 5.71 on EPS of $5.39 places Comcast at a level of earnings-based cheapness that is unusual for a company of its scale, brand, and cash flow generation. A price-to-book ratio of 1.15 against a book value per share of $26.89 means investors are paying only a small premium over the company’s net asset base.
The beta of 0.79 indicates that Comcast’s stock moves with less volatility than the broader market, a characteristic that appeals to income investors seeking to minimize drawdown risk. The analyst mean price target of $33.01 implies that the consensus view sees the stock as modestly undervalued at current levels, though the wide range of targets from $23.00 to $44.00 reflects genuine disagreement about the pace of the company’s evolution. For investors focused on dividend income, the combination of a 4.18% yield, a P/E below 6, and a payout ratio under 20% represents an unusual concentration of value in a single position, one that the market may be slow to recognize but that the underlying fundamentals support.
Risks and Considerations
The most persistent risk facing Comcast remains the continued erosion of its broadband subscriber base. Fixed wireless internet services from T-Mobile and Verizon have become credible alternatives for a growing segment of households, and the pricing and packaging competition in the connectivity market shows no sign of abating. Broadband has long been the financial engine of the cable business, and sustained net subscriber losses would eventually pressure the revenue and cash flow trajectory that underpins both the dividend and the investment thesis.
The legacy video business continues to decline structurally, and while the financial impact is partially offset by broadband and streaming growth, the pace of cord-cutting remains a headwind to consolidated revenue that management must continue to absorb. Advertising revenue tied to linear television is also under secular pressure as audience fragmentation accelerates and digital platforms capture an increasing share of marketing budgets.
Comcast carries a substantial debt load, consistent with the capital-intensive nature of its infrastructure and content businesses. While current cash flows are more than sufficient to service that debt, a meaningful deterioration in operating performance or a sustained period of elevated interest rates could increase the cost of refinancing obligations as they mature, introducing some pressure on the free cash flow available for dividends and buybacks.
The Epic Universe investment, while strategically sound, represents a concentration of capital in a single project whose success depends on consumer discretionary spending, travel patterns, and the competitive dynamics of the theme park industry. Any macro softening that reduces tourism or leisure spending could delay the expected free cash flow benefit from that investment, extending the period of elevated capex before the company sees the anticipated payback.
Regulatory and reputational considerations also remain part of the picture. Data privacy obligations, cybersecurity risks, and the scrutiny that comes with operating large media and communications platforms in an increasingly regulated environment all carry potential costs that are difficult to quantify but real in their implications for compliance spending and brand equity over time.
Final Thoughts
Comcast in early 2026 presents an income investor with a genuinely unusual combination of attributes. A 4.18% yield, a payout ratio below 20%, operating cash flow of $33.6 billion, and a P/E ratio of 5.71 do not typically coexist in a single large-cap stock, and that configuration suggests the market is applying a considerable discount to the company’s earnings and cash flow based on concerns about its long-term competitive position. Those concerns are not baseless, but the dividend history over the past three years demonstrates that Comcast has continued to raise its payout through the very period when those pressures were most visible, which reflects a management team that has confidence in the durability of its cash generation.
The Epic Universe opening and Peacock’s improving economics represent the two most tangible near-term catalysts for a rerating, and neither is speculative in the way that an early-stage growth story might be. The company is building on existing assets and customer relationships. For dividend growth investors with a multi-year time horizon, Comcast’s current price and yield combination offers a starting income return well above its historical average, backed by a payout that is deeply covered and has grown consistently. The path forward requires execution, but the financial foundation from which management is working is considerably stronger than the stock’s valuation alone might suggest.