

Updated 4/22/25
CME Group (CME) operates one of the most important financial infrastructures in the world, offering a deep range of futures and options across interest rates, commodities, equities, and more. With consistent earnings, strong cash flow, and a strategic focus on technology, the company continues to deliver for shareholders through both regular and special dividends.
Over the past year, CME has outperformed the broader market, supported by rising trading volumes and firm leadership under CEO Terry Duffy. The stock trades at a premium valuation, underpinned by robust fundamentals and a disciplined capital return strategy. As regulatory dynamics shift and global demand for risk management tools grows, CME remains well-positioned at the center of financial markets.
Recent Events
Over the past year, CME has continued to do what it does best: generate dependable earnings from strong trading activity without needing to reinvent itself. Shares have risen more than 20% over the last 12 months—well ahead of the broader market—and it’s not because of some blockbuster acquisition or dramatic pivot. It’s simply that the company is running its core business very, very well.
In the final quarter of 2024, revenue climbed 6% year-over-year, while net income grew by 7.4%. Those aren’t earth-shattering numbers, but for a business as mature and stable as CME, they’re the kind of stats income investors like to see. It speaks to consistency, not risk. Earnings per share came in at $9.66 on a trailing basis, supported by healthy operating margins north of 60%.
Importantly for dividend investors, CME followed up that performance with a healthy payout in March—part of a long-standing tradition of generous capital return to shareholders.
Key Dividend Metrics
📈 Forward Dividend Yield: 4.15%
💸 Forward Dividend Rate: $10.80 per share
📊 Payout Ratio: 107.55%
🧮 5-Year Average Dividend Yield: 3.39%
📅 Most Recent Ex-Dividend Date: March 7, 2025
🗓 Next Dividend Payment Date: March 26, 2025
Dividend Overview
One thing that sets CME apart from a lot of dividend-paying stocks is its approach. Instead of only paying a standard quarterly dividend, CME includes a special annual dividend that can add meaningful income for investors. Every January, the company reviews its financial results and—if the year was strong—adds an extra payout on top of its base dividend.
So while the regular quarterly dividend offers a modest yield on its own (around 1.75%), the total yield balloons once that special dividend is factored in. At current prices, the forward yield is sitting at a very attractive 4.15%.
The payout ratio might jump off the page at over 100%, but that’s because it includes the special dividend. When you separate out the regular quarterly payout, it’s clear that the base dividend is well covered by earnings and free cash flow. That gives the company flexibility to return cash when it has excess, without overextending itself during tougher years.
Dividend Growth and Safety
CME’s dividend track record isn’t flashy, but it’s consistent. The base dividend has grown steadily over the past several years, and the company has delivered a special dividend every year without interruption. It’s a quietly dependable setup—especially for those who like the idea of “bonus income” tied to real business performance.
The company isn’t leveraged to the hilt either. Total debt is just $3.82 billion against a market cap of over $90 billion, and the balance sheet carries more than $3 billion in cash. Free cash flow came in at $2.68 billion over the past twelve months, which easily covers both the base and special dividends.
If you’re looking at dividend safety through the lens of balance sheet strength and consistency of earnings, CME checks the boxes. With a low beta of 0.45, it also offers a smoother ride than many other financial stocks, which can swing wildly depending on the economy or interest rate cycles. CME’s stability comes from its role as a market operator, not a participant.
The average dividend yield over the past five years has been about 3.39%, so with a current forward yield over 4%, the stock looks particularly appealing for income investors today. It’s not often you get that kind of yield from a business with such strong profitability and limited exposure to credit risk or economic shocks.
Because CME’s dividend approach is built around flexibility, it allows the company to maintain its long-term commitments to shareholders without getting caught in a trap. The variable component ensures that only excess cash gets returned, while the base remains reliable.
For dividend-focused investors, this is exactly the kind of disciplined approach that can work well as part of a broader income strategy—especially when paired with other holdings that may lack this kind of payout creativity.
Cash Flow Statement
CME Group continues to show why it’s often viewed as a fortress when it comes to cash flow. Over the trailing twelve months (TTM), the company generated $3.69 billion in operating cash flow—marking a steady climb from previous years and reflecting its strong core earnings and efficient cost structure. Free cash flow came in close behind at $3.6 billion, showing minimal capital spending requirements and a business model that converts earnings to cash with minimal leakage. Capital expenditures remained light at $94 million, reinforcing the company’s capital-light setup.
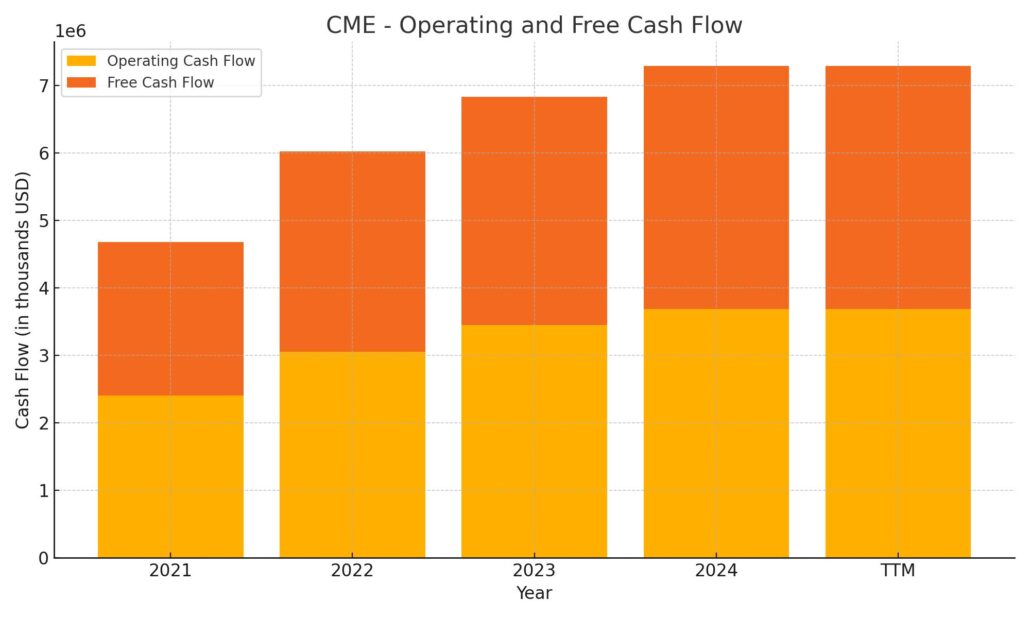
The financing cash flow section, though eye-catching, reflects CME’s special dividend payment strategy rather than debt activity. In fact, the company didn’t issue or repay debt in the latest TTM period. Instead, it returned over $5 billion to shareholders, aligning with its practice of combining regular and special dividends. The end cash position increased to $101.8 billion, providing a massive liquidity buffer and flexibility moving forward. While investing cash flow was slightly negative, at just over $82 million, it was more a reflection of modest strategic moves than any major capital deployment.
Analyst Ratings
📈 CME Group has seen a flurry of analyst activity in recent weeks, reflecting a mix of optimism and caution. Several firms have adjusted their price targets, with some raising their expectations based on the company’s solid performance and others highlighting possible headwinds that could weigh on growth.
🟢 Raymond James recently upgraded CME to an outperform rating, assigning a price target of $287. Their reasoning centers on CME’s consistent earnings delivery and strong free cash flow, which they view as a reliable foundation for long-term shareholder returns.
🟩 Morgan Stanley also lifted its stance to overweight and set an ambitious target of $301. They pointed to CME’s entrenched leadership in the global derivatives space and its ability to benefit from increased market volatility—a scenario where the company historically thrives.
🟡 Not all outlooks are rosy, though. Bank of America, while still holding an underperform rating, did increase its price target from $200 to $219. They acknowledged CME’s strong fundamentals but flagged concerns about the current valuation levels compared to future growth expectations.
🔴 Goldman Sachs echoed a similar tone, maintaining a sell rating with a revised target of $246. Their outlook reflects uncertainty about CME’s ability to drive significant revenue growth in a more stable macro environment.
📊 The current analyst consensus price target sits around $266.94, with projections ranging from a conservative $212 to a bullish $301. This spectrum suggests analysts remain generally positive but are closely watching valuation metrics and macroeconomic catalysts.
Earning Report Summary
CME Group finished 2024 on a high note, delivering a quarter that showed off the consistency and strength investors have come to expect from this financial heavyweight. The fourth quarter results were solid across the board, with revenue climbing to $1.5 billion—up 6% compared to the same time last year. Earnings per share also edged higher, landing at $2.52, a clear sign that the business is still running with impressive efficiency.
Strong Finish to the Year
The full-year numbers painted an even better picture. CME brought in a record $6.1 billion in revenue for 2024, up about 10% from the previous year. That growth wasn’t from any one corner of the business either—it was broad, touching every one of the six major asset classes they operate in. Interest rate contracts, foreign exchange, metals, agriculture—you name it, volume was up. The growth wasn’t just U.S.-driven either. International activity grew by double digits, with average daily volume from overseas customers jumping 14%.
Leadership’s Take on the Results
Terry Duffy, CME’s longtime CEO, didn’t hold back in his commentary. He called 2024 the best year in CME Group’s history and credited much of the success to the team’s focus on expanding product offerings, investing in cloud infrastructure, and keeping costs in check. Duffy also pointed out that the company is seeing stronger demand for risk management tools, especially in uncertain economic conditions—which plays right into CME’s strengths.
Looking Ahead
As for 2025, the tone from leadership is confident but grounded. Operating expenses are expected to rise modestly, with a forecast of around $1.65 billion. Capital expenditures will remain controlled, coming in around $90 million. They also plan to tweak transaction fees and data service pricing, which could lift revenue a bit more heading into the year. All of this suggests CME is sticking to its steady, methodical approach: not chasing flashy deals or risky bets, but leaning into what it does best.
With volumes already off to a strong start in early 2025, and customer interest in efficient, secure trading tools still growing, CME’s setup looks as sturdy as ever. For investors who value stability, strong cash flow, and a dependable dividend profile, it’s hard not to appreciate a company that keeps delivering without needing to shout about it.
Chart Analysis
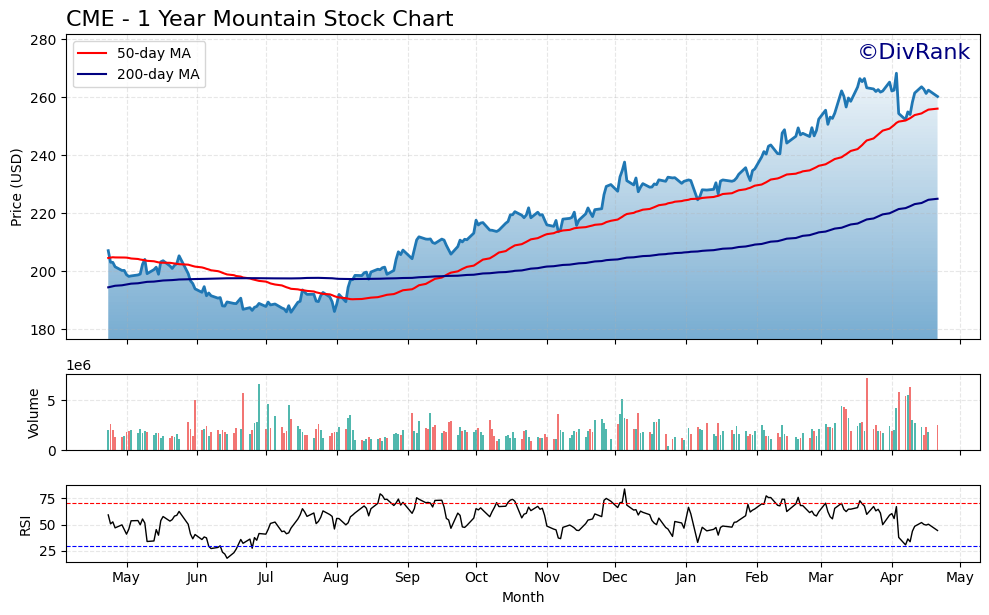
CME has been quietly building a strong uptrend over the past year, with the chart showing a steady and healthy climb from the lows of last spring. After dipping below $190 in June, the stock gradually turned the corner through late summer, then began a more consistent rise into the fall and winter. What stands out is how well the price respected both its 50-day and 200-day moving averages, especially in the second half of the year.
Moving Averages and Momentum
The 50-day moving average, shown in red, has maintained a strong upward slope since late October. It acted as dynamic support through much of the recent rally. The 200-day moving average, in blue, lagged behind but is now also clearly trending higher—another sign of long-term strength. The golden cross occurred around November when the 50-day moved above the 200-day, which often signals the beginning of a longer-term bullish phase.
Volume Behavior
Volume stayed fairly moderate through the earlier stages of the rally, but spikes began to appear around key breakout moments, especially in late January and March. That added conviction to the moves. Lately, we’ve seen a mix of high and low volume days, but nothing suggesting distribution. The recent dips weren’t accompanied by panic selling, which is a positive sign.
RSI and Market Position
The Relative Strength Index (RSI) has been fluctuating mostly in the upper-middle range since December. There were brief moments of overbought conditions above 70 in January and February, followed by periods of consolidation. Recently, the RSI dropped close to 30, which often reflects a cooling off phase or a potential short-term reset. It has since rebounded, suggesting that buyers are stepping back in without excessive froth.
Overall, CME’s chart reflects a stock that has had a methodical climb, with strong institutional support and no major technical breakdowns. The trend remains intact, and the behavior of both volume and RSI shows a market that’s pausing, not reversing.
Management Team
CME Group’s leadership is headed by Chairman and CEO Terry Duffy, who has steered the company since 2002. Under his guidance, CME has grown into one of the most influential players in the global derivatives space. His long-term vision and steady hand at the top have been key drivers of the company’s consistent performance and market dominance. In a recent extension, his role was secured through the end of 2026, giving the company continued stability at a time of rapid financial innovation and regulatory change.
There have been a few notable leadership transitions recently. Lynne Fitzpatrick has taken on the dual role of President and Chief Financial Officer, signaling a deeper focus on aligning the company’s financial oversight with its long-term strategic planning. Suzanne Sprague stepped in as Chief Operating Officer and Global Head of Clearing, following Julie Holzrichter’s transition to an advisory role after a long tenure. These moves show CME is thoughtfully evolving its executive structure to match the growing complexity of the business while staying rooted in experience.
Valuation and Stock Performance
CME’s stock has had a solid run over the past 12 months, rising just over 21% to trade around $262. It’s quietly outpaced much of the market while keeping its volatility in check, which is in line with the company’s steady business model. The stock’s current price-to-earnings ratio is about 26.9x, which places it above the sector average, but investors appear willing to pay that premium for CME’s consistent earnings and strong dividend profile.
The forward P/E sits a bit lower at 24.2x, which suggests that the market still sees room for earnings growth, albeit at a moderate pace. Analyst sentiment is mixed at the moment, with the average 12-month price target around $244. While that’s slightly below the current share price, opinions range broadly, reflecting differing views on how much upside is left in the current environment. What remains consistent, however, is recognition of CME’s strong cash generation and its ability to return capital effectively through both regular and special dividends.
Risks and Considerations
CME operates in a space that doesn’t often get rocked by sudden shifts, but it’s not without its risks. One of the more recent developments was the company receiving the green light to act as a futures broker. That gives CME the ability to interact more directly with investors, but it’s also sparked concerns from some corners of the industry about potential conflicts of interest. The closer integration between exchange and brokerage functions could attract regulatory attention, particularly in areas where neutrality is expected.
The competitive landscape is another area to watch. New trading technologies and platforms are emerging that could nibble at CME’s dominance, especially if they offer more agile or lower-cost alternatives. And then there’s the macro backdrop—rate shifts, global political tension, or prolonged periods of low market volatility can all impact trading volumes. Since CME’s revenues are tightly linked to transaction activity, quieter markets aren’t ideal.
Final Thoughts
CME Group remains one of the most enduring and stable forces in the financial markets. Its scale, product diversity, and trusted infrastructure make it hard to replicate, and its leadership continues to make decisions that reflect a long-term mindset. While it’s not immune to challenges—particularly as it expands its service offerings and adapts to a fast-changing regulatory and technological world—it’s done an admirable job staying ahead of the curve.
The company’s ability to generate dependable cash flow, return capital efficiently, and maintain relevance across market cycles speaks to a level of maturity that is difficult to find. With a firm grip on its core operations and a thoughtful eye toward the future, CME looks set to keep playing a critical role in how markets function, regardless of the environment.