

Updated 2/25/26
Cencora, Inc. (NYSE: COR), formerly known as AmerisourceBergen, remains one of the most essential connective tissues in the U.S. pharmaceutical supply chain, moving drugs from manufacturers to providers at a scale few companies can match. Shares have climbed significantly off their 52-week low of $241.48, now trading at $363.03 and sitting within striking distance of their all-time high of $377.54. The company continues to generate enormous revenue, maintain a conservative dividend payout, and attract a broadly positive analyst consensus, even as the stock’s premium valuation demands careful scrutiny from income investors.
Recent Events
Cencora has continued its strategic expansion in specialty pharmaceutical distribution, a segment that has been one of the clearest growth drivers in the business over the past several quarters. The company’s deepening presence in oncology and rare disease distribution reflects an industry-wide shift toward higher-complexity, higher-margin therapeutic categories, and Cencora has positioned itself well ahead of that curve. Its 2024 acquisition of Retina Consultants of America has continued to integrate into the broader specialty care platform, reinforcing management’s stated focus on building out physician-centric services beyond traditional wholesale distribution.
On the leadership front, CEO Bob Mauch, who took the helm in October 2024, has now had several quarters to put his operational stamp on the business. Early indications suggest a continued emphasis on technology investment, global expansion, and disciplined capital allocation. CFO Jim Cleary remains a stabilizing presence on the financial side, and the broader executive team assembled over the past year has been focused on modernizing the company’s data and digital infrastructure under Chief Data and Information Officer Pawan Verma.
The macroeconomic backdrop has been reasonably favorable for drug distributors. Demand for GLP-1 medications, oncology therapies, and specialty biologics has shown no signs of cooling, and Cencora’s distribution relationships with major pharmaceutical manufacturers keep it well-positioned to benefit from volume growth in those categories. Revenue has climbed to approximately $325.8 billion on a trailing basis, a figure that reflects both the scale of the business and the continued expansion of its product and service footprint. The stock’s beta of 0.69 reflects the defensive character of the business, offering investors meaningful insulation during periods of broader market turbulence.
Key Dividend Metrics
📈 Forward Dividend Yield: 0.62%
💸 Annual Dividend (Forward): $2.40
🧮 Payout Ratio: 27.01%
📅 Last Dividend Payment: $0.60 per share (February 13, 2026)
📉 Trailing Dividend Yield: 0.62%
📊 Recent Dividend Growth: Raised from $0.55 to $0.60 per quarter in November 2025
🔔 Dividend Safety: Conservative payout ratio with strong free cash flow coverage
📈 Dividend Growth Rate: Consistent increases across each fiscal year
Dividend Overview
Cencora is not a stock you buy for yield, and anyone expecting a fat income check from a sub-1% yield will need to look elsewhere. What the company does offer is a reliable, growing dividend backed by an enormous and relatively predictable business. The current annual dividend of $2.40 per share, paid in quarterly installments of $0.60, is covered comfortably by earnings, with a payout ratio of just 27.01% against reported EPS of $8.34. That is one of the more conservative payout ratios in the healthcare sector.
The yield compression story continues here. The current yield of 0.62% is well below the five-year historical average, and that gap is almost entirely explained by a stock price that has risen faster than the dividend has grown. That dynamic is a feature, not a bug, for long-term total return investors, but pure income seekers should understand the tradeoff. You are essentially accepting a lower current yield in exchange for a business with durable competitive positioning and continued dividend growth potential.
Free cash flow of approximately $3.46 billion for the trailing period dwarfs the dividend obligation by a wide margin, providing significant cushion even in a scenario where earnings face temporary pressure. That coverage ratio makes the dividend one of the more secure payouts in the large-cap healthcare space, even if the absolute yield is modest.
Dividend Growth and Safety
The most recent dividend increase, announced in November 2025, lifted the quarterly payment from $0.55 to $0.60 per share, a raise of approximately 9.1%. That followed a prior increase from $0.51 to $0.55 in November 2024, continuing a pattern of annual hikes that has been reliable across multiple business cycles. Tracing back through the recent history, the quarterly dividend has moved from $0.485 in early 2023 to $0.60 today, representing a cumulative increase of nearly 24% in under three years.
That trajectory is meaningful for dividend growth investors. While the increases are not dramatic in isolation, they compound reliably and arrive with a consistency that signals genuine management commitment to returning capital to shareholders. The payout ratio of 27.01% is low enough that the company could absorb a meaningful earnings decline without threatening the dividend, and free cash flow coverage is strong enough to sustain the current payment even in a stress scenario.
The defensive nature of pharmaceutical distribution also underpins dividend safety in a structural way. People do not stop taking medications during recessions, and Cencora’s role as an intermediary between manufacturers and providers is extraordinarily difficult to displace at the volumes and service levels it operates. Return on equity of 133.47% reflects the capital-light efficiency of the distribution model, even if the figure is amplified by the company’s lean book value. For dividend investors focused on reliability and predictable growth rather than headline yield, Cencora remains one of the more compelling options in the healthcare sector.
Chart Analysis
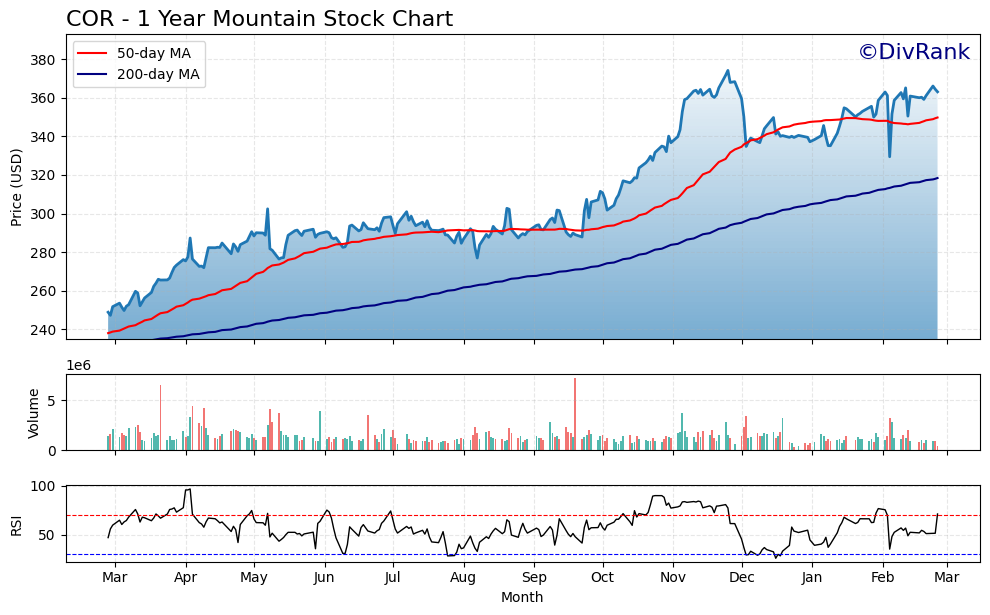
COR has staged an impressive recovery over the past year, climbing 46.83% off its 52-week low of $247.24 to trade near $363.03 as of the most recent session. That kind of price appreciation from trough to current levels reflects a meaningful shift in investor sentiment toward the stock, and the trajectory has been largely sustained rather than a sharp spike followed by a fade. With the 52-week high sitting at $374.11, COR is trading within roughly 3% of its annual peak, which puts it firmly in the upper range of its recent price history. For a healthcare distribution business with the earnings stability that COR typically delivers, this kind of price behavior signals that the market has been repricing the stock’s risk profile in a constructive direction.
The moving average setup reinforces that bullish read on the trend. COR is trading above both its 50-day moving average of $349.73 and its 200-day moving average of $318.38, and the 50-day has crossed above the 200-day to form what technicians refer to as a golden cross. That configuration tends to indicate that shorter-term price momentum is running ahead of the longer-term trend, which is generally a sign of strengthening rather than deteriorating price action. The distance between the current price and the 200-day average is also meaningful here, as a spread of roughly $44 per share suggests the longer-term trend has room to continue rising before the two converge in any concerning way.
The RSI reading of 71.19 deserves attention, as it places COR just above the conventional overbought threshold of 70. This does not automatically signal an imminent reversal, but it does suggest that the stock has absorbed considerable buying pressure in a relatively short period of time. Investors who are considering initiating or adding to a position may want to allow for some consolidation before committing new capital, particularly given how close the current price is to the 52-week high. A modest pullback toward the 50-day moving average around $349 would represent a more comfortable entry point from a risk management standpoint without requiring any change in the underlying thesis.
For dividend investors, the overall technical picture is encouraging rather than alarming. The trend is intact, the moving average structure is constructive, and the proximity to the 52-week high reflects genuine fundamental confidence rather than speculative froth. The slightly elevated RSI is the one flag worth monitoring in the near term, but it is a timing consideration rather than a reason to question the longer-term income thesis. Investors already holding COR for its dividend growth characteristics are in a strong position, and those looking to establish a new stake would be well served by watching for a brief consolidation before adding exposure.
Cash Flow Statement
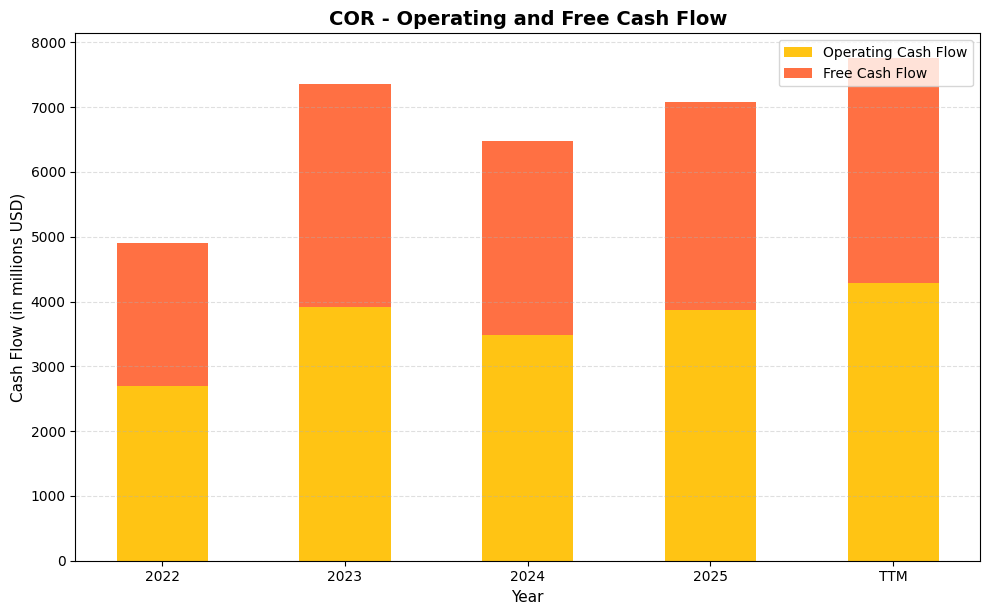
Cencora’s cash generation tells a compelling story for income investors. Operating cash flow climbed from $2,703.1 million in 2022 to $3,911.3 million in 2023, dipped modestly to $3,484.7 million in 2024, then recovered to $3,875.1 million in 2025, with the trailing twelve months pushing even further to $4,288.7 million. Free cash flow has tracked in lockstep, rising from $2,206.8 million in 2022 to a TTM figure of $3,463.3 million after accounting for capital expenditures. With the company paying out roughly $600 million annually in dividends at current levels, the free cash flow coverage ratio sits comfortably above 5x, which is an exceptionally wide margin of safety for dividend sustainability and leaves ample room for continued payout growth.
The broader trend across this four-year window reveals a business that has more than doubled its free cash flow generation in a relatively short period, which speaks directly to the capital-light nature of pharmaceutical distribution at scale. Capital expenditures have remained disciplined throughout, consistently consuming less than $500 million per year against an operating cash flow base that now exceeds $4 billion on a trailing basis. The 2023 step-up in operating cash flow reflected working capital improvements and volume growth tied to the Alliance Healthcare integration, and the 2024 dip was transitory rather than structural, as the 2025 rebound and subsequent TTM acceleration confirm. For shareholders, this trajectory means the dividend is not only well-covered today but is supported by an underlying cash engine with genuine capacity to fund higher payouts, share repurchases, and strategic acquisitions simultaneously without stretching the balance sheet.
Analyst Ratings
The analyst community remains broadly constructive on Cencora, with a consensus buy rating from 14 covering analysts. The mean price target of $403.79 implies roughly 11% upside from the current price of $363.03, which is a reasonable but not aggressive return expectation given where the stock has already traveled over the past year. The range of targets is fairly wide, from a low of $340.00 to a high of $440.00, reflecting some dispersion of opinion on how quickly the specialty distribution buildout will translate into earnings growth and how the market will ultimately value that mix shift.
The $340.00 floor target from the most conservative analyst sits modestly below the current price, suggesting even the bears in the coverage universe are not calling for dramatic downside. That floor likely reflects concern about valuation compression if earnings growth slows or if competitive pressures in the distribution channel intensify. Meanwhile, the $440.00 bull case implies a scenario where Cencora’s specialty services expansion accelerates and the market continues to award the business a premium multiple for its defensive growth characteristics.
With the stock trading at $363.03 and the mean target at $403.79, the setup is not a screaming value, but it is also not a situation where the stock has run well past what analysts are willing to support. For income investors, the analyst backdrop provides a reasonable baseline of confidence that the business is executing and that the current share price is defensible at current earnings levels.
Earnings Report Summary
Cencora has continued to generate impressive top-line results, with trailing revenue reaching approximately $325.8 billion, reflecting the scale of its pharmaceutical distribution operations and the ongoing volume growth in specialty categories. EPS on a reported basis came in at $8.34, supported by a net income figure of approximately $1.63 billion. The profit margin of 0.50% is consistent with the razor-thin economics of large-scale drug distribution, where the model depends on volume, velocity, and operational precision rather than fat margins.
Strong Revenue Scale With Modest Margin Compression
The gap between top-line revenue and bottom-line profit is a defining feature of this business model, and investors who focus only on the 0.50% margin miss the point. What matters is the absolute cash generation capacity, and with operating cash flow of $4.29 billion and free cash flow of $3.46 billion on a trailing basis, the business is clearly producing more than enough to fund its dividend, share repurchase program, and growth investments simultaneously. Return on assets of 3.33% is modest but consistent with the asset-intensive nature of wholesale distribution at this scale.
Specialty Segment Driving Mix Improvement
Management has consistently pointed to the specialty pharmaceutical segment as the primary engine of value creation going forward, and recent results support that narrative. Demand trends in oncology, immunology, and GLP-1 medications have remained robust, and Cencora’s distribution relationships in those therapeutic areas have continued to deepen. The Retina Consultants of America integration and similar physician-services acquisitions are gradually shifting the revenue mix toward higher-margin activities, which should support modest margin improvement over the medium term even if headline margin percentages remain low.
Guidance and Forward Outlook
Management has maintained an upbeat tone on the company’s trajectory, with prior guidance for adjusted diluted EPS in the range of $15.25 to $15.55 serving as a reference point for the year. The reported EPS of $8.34 on a GAAP basis reflects various below-the-line adjustments relative to the adjusted figure management emphasizes, and analysts have generally focused on the adjusted metric when evaluating performance against expectations. The overall message from leadership has been one of disciplined execution, targeted investment in specialty services, and continued confidence in the core distribution franchise.
Management Team
Bob Mauch is now well into his tenure as CEO, having taken the role in October 2024, and the organization appears to have absorbed the leadership transition smoothly. His background in operations and his familiarity with Cencora’s business from prior executive roles have made for a more seamless handoff than many CEO changes produce. The strategic priorities he has articulated, including specialty services expansion, technology modernization, and disciplined capital allocation, are consistent with the direction the company was already heading, which has helped maintain continuity for investors and employees alike.
CFO Jim Cleary, in his role since 2018, remains one of the more experienced financial stewards in the healthcare distribution space. His approach to balance sheet management and capital returns has been consistently conservative in the best sense of the word, prioritizing sustainable shareholder returns over financial engineering. The broader leadership team, including Chief Legal Officer Elizabeth Campbell, CHRO Silvana Battaglia, EVP of Strategy and M&A Francois Mandeville, and Chief Data and Information Officer Pawan Verma, has continued to mature and execute against its respective mandates. Mandeville’s presence in the strategy and M&A role signals continued appetite for bolt-on acquisitions that extend the specialty services platform, and Verma’s digital modernization agenda is increasingly relevant as the company competes on service quality and data capabilities alongside pure distribution scale.
Valuation and Stock Performance
At $363.03, Cencora is trading near the upper end of its 52-week range of $241.48 to $377.54, which means the stock has nearly recovered its full 52-week span in price from trough to near peak. That recovery has been substantial, and it reflects renewed confidence in the business after a period of investor uncertainty. The trailing P/E ratio of 43.53 is meaningfully higher than the prior report’s 40.33, which tells you the market has continued to re-rate the stock even as earnings have grown. That multiple expansion is a yellow flag for value-conscious investors.
The price-to-book ratio of 37.01, with book value per share of just $9.81, reflects the capital-light distribution model and the effect of sustained share repurchases on the equity base. That ratio is not particularly useful as a standalone valuation tool for this type of business, but it does illustrate how much of the investment case rests on earnings power and cash generation rather than asset value. With a market cap of approximately $70.6 billion and free cash flow of $3.46 billion, the free cash flow yield is roughly 4.9%, which is not egregious for a business of this quality and defensiveness, but it does suggest the easy money has likely already been made at lower price levels. The mean analyst price target of $403.79 implies upside from here, and the stock’s low beta of 0.69 makes it a relatively comfortable hold for income investors who prioritize stability over excitement.
Risks and Considerations
The most persistent structural risk for Cencora is disintermediation. Large healthcare systems and pharmacy benefit managers have periodically explored direct purchasing arrangements with pharmaceutical manufacturers that would reduce or eliminate the role of distributors like Cencora. While the operational complexity of replicating what Cencora does at scale has historically protected the company, that risk does not disappear, and any meaningful shift in purchasing dynamics among large clients could pressure both volumes and margins in ways that would be difficult to offset quickly.
Cybersecurity remains an area of genuine concern. The 2023 data breach that compromised patient information was a reminder that even companies focused primarily on physical distribution carry significant digital risk. As Cencora invests more in technology infrastructure and data-driven services, its attack surface grows, and the reputational and regulatory consequences of another breach could be more severe as the digital component of the business becomes more central to its value proposition.
The opioid litigation overhang, while reduced from its peak, has not fully resolved. Cencora has reached major settlements, but ongoing litigation from municipalities, states, and other parties continues to represent a potential source of unexpected cash outflows. The financial exposure is manageable given the company’s cash generation capacity, but the legal complexity and reputational dimensions of the issue persist.
Finally, the valuation leaves limited room for error. A P/E of 43.53 means the market has priced in a great deal of continued execution. If an earnings report disappoints, if specialty segment growth slows, or if a macro disruption compresses pharmaceutical volumes, the stock could correct sharply from a multiple that reflects near-perfection. Income investors comfortable with a low yield and a long time horizon can absorb that volatility, but it is a real risk at today’s price levels.
Final Thoughts
Cencora remains one of the most defensively positioned large-cap names in the healthcare sector, and its dividend, while modest in yield, is among the more secure and steadily growing payouts available at this market cap tier. The most recent increase from $0.55 to $0.60 per quarter, representing a 9.1% raise, continues a pattern of reliable annual hikes that compound meaningfully over a full investment horizon. With a payout ratio of just 27.01% and free cash flow of $3.46 billion supporting a total dividend obligation that represents a small fraction of that figure, the sustainability of the income stream is not in question.
The tougher question is whether the stock makes sense as a new purchase at $363.03. The analyst consensus points to modest upside toward $403.79, and the business fundamentals are genuinely strong, but the P/E of 43.53 demands continued execution without misstep. For existing holders, the case for staying put is straightforward. For new investors, the entry point requires accepting a premium valuation and a low starting yield in exchange for long-term dividend growth and the stability of an irreplaceable position in the healthcare supply chain. That is a trade-off worth making for the right kind of investor.