

Updated 2/25/26
Capital Southwest Corporation (NASDAQ: CSWC) is a business development company that specializes in providing flexible financing to lower middle-market companies. With a portfolio anchored in first lien senior secured debt and a growing equity co-investment component, CSWC combines credit discipline with income generation. Its dividend yield, currently above 10%, is supported by a layered approach that includes both regular and supplemental payouts. The leadership team installed during last year’s transition, with Michael Sarner as CEO and Josh Weinstein as CIO, has now had time to establish its strategic direction. The stock has recovered meaningfully from its early 2025 lows and is now trading near the upper end of its 52-week range, with analysts carrying a consensus buy rating and a mean price target above the current price. For those seeking income backed by a consistent lending strategy, CSWC remains one of the more recognizable names in the BDC space.
Recent Events
Capital Southwest has been active on several fronts heading into early 2026. The company continued to deploy its layered dividend structure through the second half of 2025, maintaining its regular monthly base payment while issuing supplemental distributions in September and December, each at $0.253 per share. This pattern reflects management’s ongoing effort to pass through excess income to shareholders rather than retain it, a hallmark of the internally managed BDC model CSWC employs.
The company has also been navigating a broader shift in the credit environment. As interest rate expectations evolved through 2025, BDCs with floating-rate portfolios faced some compression in net investment income, and CSWC was not insulated from that dynamic. The transition in payout structure, from quarterly distributions running above $0.63 per share in late 2024 and early 2025 to a monthly format with regular payments of $0.193 and periodic supplementals, signals a recalibration of how management is structuring shareholder returns in the current environment. The stock has responded constructively, climbing from a 52-week low of $17.46 to trade near $22.97 as of late February 2026, approaching its 52-week high of $23.84.
On the capital markets front, CSWC’s internally managed structure continues to be a differentiator. Unlike externally managed peers that pay advisory fees to outside managers, CSWC’s cost structure is more directly aligned with shareholder outcomes, and that efficiency remains a selling point as the company competes for deal flow in the lower middle market.
Key Dividend Metrics
💰 Forward Dividend Yield: 10.30%
📈 Annual Dividend: $3.20
📅 Last Dividend Payment: $0.193
📊 Payout Ratio: 152.14%
🔁 5-Year Average Yield: 9.67%
📌 Recent Supplemental Payment: $0.253
📌 EPS (TTM): $1.81
Dividend Overview
CSWC is currently offering a dividend yield of 10.30%, which remains well above the company’s five-year average yield of approximately 9.67%. That premium above the historical average reflects a combination of elevated distribution levels and a stock price that, while recovered from its lows, has not fully closed the gap to prior peaks. The annualized dividend rate of $3.20 per share encompasses both the regular monthly payments and the supplemental distributions that management has layered in during higher-income periods.
The shift to a monthly payout cadence, with a base rate of $0.193 per share and supplemental payments of $0.253 added in September and December 2025, gives management a more granular tool for matching distributions to realized income. This structure is consistent with how CSWC has always approached its dividend, using the supplemental component to pass through gains and excess net investment income without permanently committing to a higher base rate.
The payout ratio sits at 152.14% on a GAAP basis, which looks elevated but is characteristic of BDCs. As with most companies in this structure, GAAP earnings include non-cash items and fair value adjustments that can suppress reported net income even when cash generation from the loan portfolio is healthy. The more relevant metric for dividend sustainability is net investment income coverage, and CSWC has historically maintained coverage that supports its distributions. Investors should track that figure closely as quarterly results are reported.
Dividend Growth and Safety
Looking at CSWC’s recent dividend history, the trajectory reflects a company managing through a transitional period. Quarterly payouts were running at $0.63 to $0.64 per share through early 2025, and the move to a monthly structure brought the base rate to $0.193 per share. On an annualized basis, the $3.20 per share total distribution, inclusive of supplementals, represents a meaningful income stream relative to the current stock price.
The safety of that distribution rests on several pillars. First, CSWC’s portfolio is weighted heavily toward first lien senior secured loans, which sit at the top of the capital structure and offer more downside protection in credit stress scenarios. Second, the internally managed structure keeps operating costs lower than externally managed peers, which improves the efficiency with which portfolio income flows to shareholders. Third, management has a track record of using the supplemental mechanism as a buffer, reducing it or holding it back when income generation softens rather than cutting the base dividend.
Return on equity of 11.29% and a profit margin of 45.46% suggest the underlying portfolio is generating reasonable returns even as the interest rate environment has shifted. The book value per share of $16.75 provides a reference point for NAV, and with the stock trading at roughly 1.37 times book, investors are paying a modest premium that is consistent with CSWC’s historical trading range and its internally managed status. As long as credit quality in the portfolio remains intact and net investment income continues to cover the base distribution, the dividend structure appears sustainable at current levels.
Chart Analysis
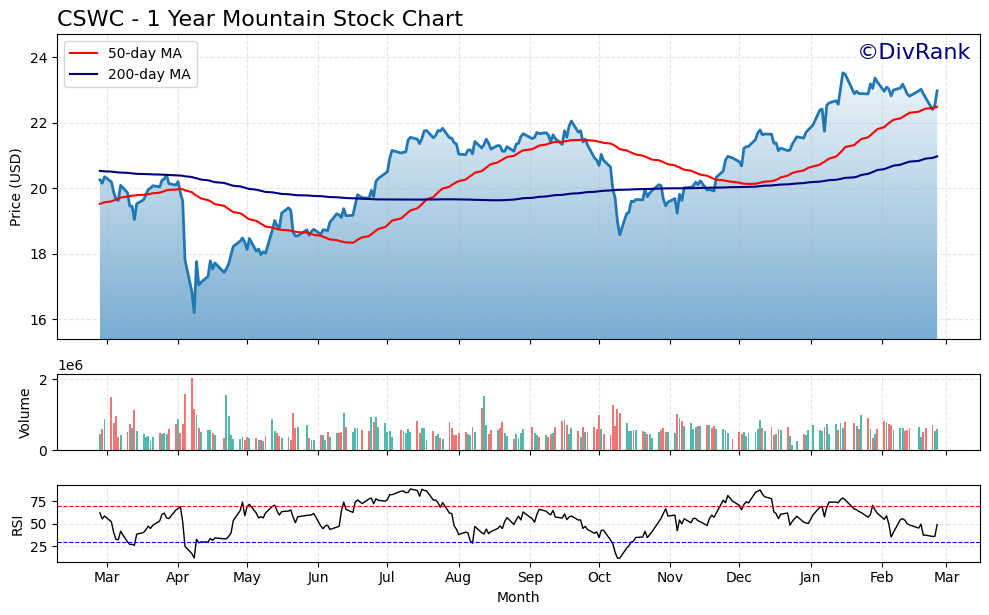
Capital Southwest has staged an impressive recovery over the past twelve months, climbing roughly 42% off its 52-week low of $16.19 to trade at $22.97 as of the most recent session. That kind of price appreciation is meaningful for a BDC, where total return narratives often take a back seat to yield discussions. The stock is now within striking distance of its 52-week high of $23.52, sitting just 2.3% below that level, which tells you that buyers have been persistent and that the recovery from last year’s lows was not a short-lived bounce. The overall trend across the trailing year is clearly constructive, with the price action reflecting growing investor confidence in CSWC’s credit quality and income consistency.
The moving average picture reinforces that constructive read. CSWC is trading above both its 50-day moving average of $22.48 and its 200-day moving average of $20.97, and crucially, the 50-day has crossed above the 200-day to form a golden cross. Technicians treat this pattern as a meaningful confirmation that the intermediate trend has aligned with the longer-term trend, and for dividend investors, it adds a layer of reassurance that the price recovery has durability rather than being a speculative spike. The spread between the two moving averages, roughly $1.51, suggests the uptrend has been developing steadily rather than erupting in a single burst, which is generally the healthier configuration.
The RSI reading of 48.8 lands almost exactly in neutral territory, which is arguably the most comfortable zone for a dividend investor looking to initiate or add to a position. The stock is neither overbought nor oversold, meaning you are not chasing a momentum crowd at elevated prices and you are not catching a falling knife. With RSI hugging the midpoint, there is no technical signal suggesting imminent exhaustion of the current trend, and the absence of extreme readings on either side gives the setup a low-drama quality that income-focused portfolios tend to appreciate.
Taken together, the technical picture for CSWC is quietly supportive. A golden cross, a price sitting just below multi-month highs, and a neutral RSI combine to paint a backdrop that does not flash any obvious warning signs for dividend investors. The stock is not cheap on a price basis relative to where it was a year ago, but the chart suggests the market is pricing in a fundamentally improved outlook rather than simply speculating. For investors whose primary interest is the income stream, the technical setup offers a reasonable entry context without requiring a bet on a breakout or a recovery from distress.
Cash Flow Statement
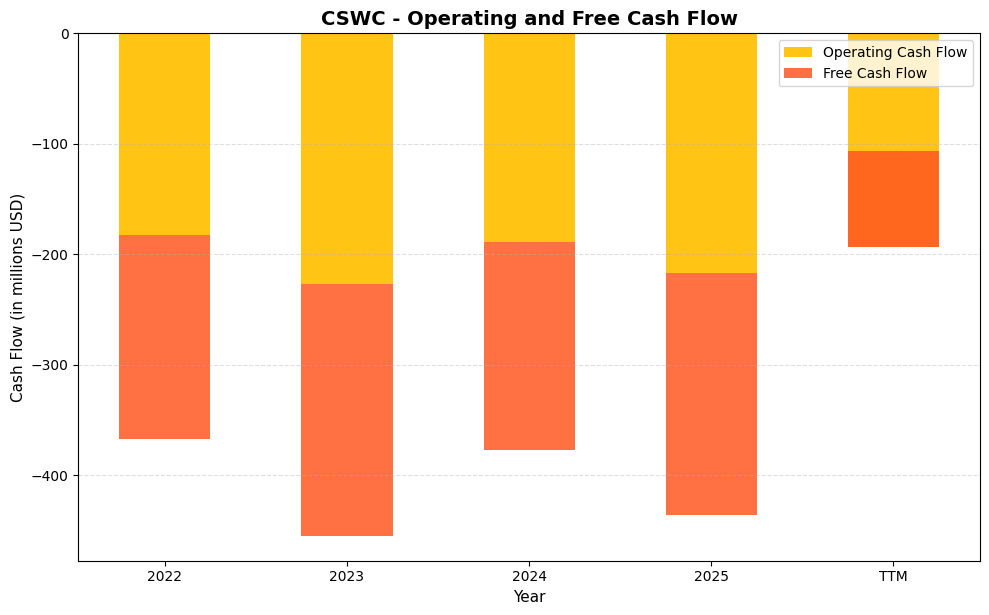
Capital Southwest’s cash flow statement requires the right interpretive lens to be useful for dividend sustainability analysis. As a business development company, CSWC deploys capital into loans and equity investments as its core operating activity, which means large negative operating and free cash flows are structural, not distress signals. Operating cash flow has run between roughly negative $183 million and negative $227 million over the 2022 through 2025 fiscal years, with free cash flow tracking nearly in lockstep given the company’s minimal capital expenditure requirements. The TTM figure, however, introduces an interesting divergence: operating cash flow improved to negative $193.1 million while free cash flow turned sharply positive at $87.0 million, suggesting a meaningful shift in the timing or composition of investment activity. For income investors, the relevant dividend sustainability metrics for a BDC are net investment income and undistributed spillover income, both of which CSWC has consistently reported at levels that support or exceed its declared distributions.
Stepping back across the full four-year span, the operating cash flow trend is not a straight line deterioration. The low point came in fiscal 2023 at negative $227.1 million, which corresponded with an aggressive portfolio growth phase as CSWC scaled its direct lending platform and expanded its credit facility. Fiscal 2024 and the TTM period both show a pullback toward the negative $188 to $193 million range, indicating a more measured deployment pace rather than a retreat from growth. Capital efficiency in this business model is best evaluated through return on equity and the spread between portfolio yield and cost of capital, both of which have remained favorable for CSWC shareholders over this period. The positive TTM free cash flow reading reinforces that the company is generating more liquidity from portfolio realizations and repayments than it is consuming in new originations on a net basis, which is a constructive signal for the near-term dividend coverage picture.
Analyst Ratings
The analyst community covering Capital Southwest has shifted to a more constructive stance compared to a year ago, with the consensus now sitting at a buy rating across six covering analysts. That upgrade in sentiment aligns with the stock’s recovery from its 2025 lows and reflects growing confidence in the company’s portfolio quality and dividend structure under its current management team.
The mean price target of $24.25 implies approximately 5.6% upside from the current price of $22.97, a more modest spread than earlier periods when the stock was trading well below consensus targets. The range of targets runs from a low of $21.00 to a high of $27.00, with the upper end suggesting that more optimistic analysts see room for meaningful appreciation if credit conditions remain favorable and net investment income stabilizes or improves. The low end of $21.00 sits below the current price, indicating that even the most cautious analyst in the group does not view the stock as significantly overvalued, but rather as fairly priced with limited near-term catalyst risk. The overall picture is one of measured optimism, with analysts broadly supportive of the income thesis while keeping targets grounded given the current interest rate backdrop.
Earnings Report Summary
Solid Results with Strong Dividend Coverage
Capital Southwest Corporation has continued to report results consistent with its credit-focused strategy, generating net income of approximately $101.5 million over the trailing twelve months, or $1.81 per share. Revenue came in at $226.7 million, supported by the income generated across a diversified portfolio of first lien loans and equity co-investments. The profit margin of 45.46% reflects the efficiency of the internally managed structure, where operating expenses are contained and portfolio income flows more directly to the bottom line.
Portfolio Growth and Activity
The investment portfolio has continued to develop across both the debt and equity components. First lien senior secured loans remain the dominant asset class, providing a stable and predictable income base. The average yield on debt positions has remained competitive relative to the BDC peer group, driven by the floating-rate nature of most holdings. New commitments have been made across both existing portfolio companies and new borrowers, reflecting a steady pipeline in the lower middle market even as the broader deal environment has been selective.
Valuation Swings and NAV Stability
Book value per share of $16.75 provides the clearest window into portfolio health, and the current price-to-book of 1.37 suggests the market is assigning a premium to CSWC’s earning power and management quality. Return on assets of 6.22% and return on equity of 11.29% are both healthy metrics for a BDC operating in the current environment. Any fair value movements in the credit portfolio have been managed without a significant deterioration in NAV, which is the outcome management has consistently targeted.
Liquidity and Capital Moves
The company’s liquidity position remains adequate, supported by its revolving credit facility and the proceeds from ongoing equity issuances through its ATM program. The shift in dividend structure to a monthly format also provides more flexibility in matching cash outflows to portfolio income receipts. With a beta of 0.78, the stock has shown less volatility than the broader market over the past year, which is a characteristic that income-focused investors generally find appealing in a BDC holding.
What’s Ahead
The outlook for CSWC centers on whether net investment income can sustain the current distribution level as interest rates evolve. Management has demonstrated a willingness to use the supplemental dividend as the variable component, which gives the base payout more insulation. The company’s second SBIC license application, if progressed, would provide access to additional low-cost capital that could support portfolio growth and improve earnings per share. With six analysts at a buy consensus and a mean target above the current price, the near-term expectation is for continued steady performance.
Management Team
Capital Southwest Corporation’s leadership team, now well into its tenure following the transitions completed in 2025, has established a clear operating rhythm. Michael Sarner serves as President and CEO, bringing over three decades of finance and BDC experience to the role. Before becoming CEO, Sarner played a central part in raising more than $2 billion in debt and equity for the company, and his prior tenure as CFO at American Capital adds a strong capital markets dimension to his strategic perspective.
Josh Weinstein leads the investment function as Chief Investment Officer, drawing on nearly a decade with the firm to guide credit selection and portfolio management. His deep familiarity with the existing portfolio and borrower relationships is an asset as the company navigates a more selective deal environment. Chris Rehberger continues as CFO, Treasurer, and Secretary, providing financial planning discipline and internal controls oversight that supports the company’s reporting and capital allocation decisions.
The board of directors provides governance oversight across this management structure, with David R. Brooks serving as chair alongside directors including Christine S. Battist and Jack D. Furst. Their collective experience in finance and corporate governance supports the accountability framework that internally managed BDCs rely on to maintain alignment between management and shareholder interests.
Valuation and Stock Performance
As of late February 2026, CSWC is trading at $22.97, giving the company a market capitalization of approximately $1.38 billion. The trailing P/E ratio of 12.69 reflects current earnings levels, and the price-to-book ratio of 1.37 indicates the stock is trading at a modest premium to its net asset value of $16.75 per share. That premium is consistent with the market’s recognition of CSWC’s internally managed structure and its track record of portfolio income generation.
The stock’s 52-week range of $17.46 to $23.84 tells a recovery story. Shares bottomed out in early 2025 and have climbed steadily since, now sitting near the top of the range and within reach of the 52-week high. That represents a gain of more than 31% from the low, a meaningful move for a company whose income investors often think of as a steady rather than dynamic holding. The beta of 0.78 confirms that CSWC has exhibited below-market volatility over this period, which aligns with its credit-oriented business model.
The mean analyst price target of $24.25 implies modest additional upside from current levels, with the high target of $27.00 representing roughly 17.5% potential appreciation. For income investors, the combination of a 10.30% yield and low single-digit price appreciation potential produces a total return profile that remains attractive relative to most fixed income alternatives.
Risks and Considerations
The payout ratio of 152.14%, while typical for BDCs on a GAAP basis, is a number that warrants ongoing monitoring. The sustainability of the $3.20 annual distribution depends on net investment income remaining at levels sufficient to cover the base monthly payment and support the periodic supplementals. If floating rates decline meaningfully or credit spreads compress, the income generated by the portfolio could narrow and put pressure on the distribution.
Credit quality within the portfolio is the most consequential ongoing risk. The lower middle market segment that CSWC targets carries more idiosyncratic borrower risk than larger corporate lending markets. A rise in non-accruals or realized credit losses could erode NAV and reduce the income available for distribution. The concentration in first lien positions provides some protection, but it does not eliminate the risk of borrower stress during economic downturns.
The company’s leverage profile, while within normal BDC parameters, means that changes in funding costs have a direct impact on net investment income spread. Rising borrowing costs or tighter credit facility terms could compress margins even if portfolio yields hold steady. The debt-to-equity level requires management to remain disciplined about new commitments and to maintain adequate liquidity buffers.
With the stock now trading near the top of its 52-week range and at 1.37 times book, the valuation leaves less margin of safety than existed when shares were closer to $17.46. Investors entering at current prices are accepting a higher starting valuation, which makes the income return a larger component of the total return thesis and amplifies the importance of dividend stability going forward.
Final Thoughts
Capital Southwest continues to offer one of the more compelling income profiles in the BDC space, combining a 10.30% yield with an internally managed structure that keeps costs aligned with shareholder interests. The stock’s recovery from its 2025 lows reflects both improving market sentiment toward BDCs and confidence in the current management team’s ability to maintain portfolio quality and shareholder returns.
The layered dividend structure, with a stable monthly base and periodic supplementals, gives the company flexibility to reward shareholders during stronger income periods while protecting the base payout when conditions tighten. That architecture is one of the more thoughtful approaches in the peer group and has contributed to CSWC’s reputation as a reliable income source.
The risks are real and worth respecting. Credit quality, leverage, and interest rate sensitivity are permanent features of the BDC business model, and the current valuation near the top of the 52-week range means there is less room for disappointment. But for investors whose primary objective is consistent cash flow from a professionally managed credit portfolio, CSWC’s combination of yield, management quality, and structural discipline makes it a name that belongs on the income investor’s watchlist.