

Updated 2/25/26
Cabot Corporation (CBT) operates in the specialty chemicals space, supplying critical materials used in performance and reinforcement applications, including tire manufacturing, battery materials, and specialty carbons. With a global footprint and a consistent approach to capital allocation, the company combines steady cash flow with disciplined growth investments. Over the past year, Cabot has delivered solid earnings, maintained a manageable balance sheet, and continued returning capital to shareholders through dividends and buybacks. The company generated $3.6 billion in revenue and $306 million in net income on a trailing basis, with operating cash flow reaching $667 million. Though the stock has pulled back from its 52-week high near $89, Cabot trades at a reasonable valuation and continues to generate reliable free cash flow. For investors focused on income and long-term operational strength, the company offers a well-rounded story.
🔍 Recent Events
Cabot Corporation has continued to execute on its specialty chemicals strategy as it moves through fiscal 2026, with the business demonstrating consistent operational performance across its two core segments. The company has maintained its focus on battery materials and specialty carbons, areas where management has signaled ongoing investment as electric vehicle adoption and energy storage demand create durable long-term tailwinds. These growth categories have helped Cabot differentiate itself from more commodity-oriented chemical producers and position the portfolio toward higher-margin, innovation-driven applications.
The stock has spent much of the past several months trading in a wide range, with shares currently at $75.87 against a 52-week range of $58.33 to $89.15. That places the current price near the middle of its annual trading band, reflecting a market that is weighing Cabot’s steady fundamentals against a broader industrial backdrop that remains uneven. Return on equity stands at 21.82% and return on assets at 10.22%, both of which reflect a business running with real financial efficiency even as top-line growth has been measured rather than dramatic.
On the capital allocation front, Cabot has continued to prioritize shareholder returns alongside investment in its growth pipeline. Free cash flow of $291.6 million on a trailing basis provides a credible base from which the company can fund dividends, reduce debt, and selectively repurchase shares. With short interest at roughly 2.28 million shares, there is no meaningful speculative pressure on the stock, and the fundamental dividend story remains intact.
📊 Key Dividend Metrics
💸 Forward Dividend Yield: 2.35%
🔁 5-Year Average Yield: 2.37%
📆 Last Ex-Dividend Date: November 28, 2025
💵 Dividend Payout Ratio: 31.12%
📈 Annual Dividend: $1.80 per share
🛡️ Dividend Safety: High, supported by strong operating cash flow
🧾 Operating Cash Flow (TTM): $667 million
📉 Stock Performance (52-Week Range): $58.33 – $89.15
🏦 Last Quarterly Payment: $0.45 per share
💰 Dividend Overview
Cabot’s current yield of 2.35% sits right in line with its five-year average yield of approximately 2.37%, which tells a consistent story about how the market has historically priced this income stream. The company’s annual dividend of $1.80 per share is well supported by earnings, with a payout ratio of just over 31%. That remains firmly within the safe zone for a specialty chemicals business and signals a management team that is deliberate about balancing shareholder rewards with reinvestment needs.
The most recent quarterly payment of $0.45 per share reflects an increase from the $0.43 rate that was paid through much of 2024 and into early 2025, with the step-up taking effect in May 2025. That increase, while modest in absolute terms, continues the pattern of slow and steady dividend progression that income investors have come to expect from Cabot. The company has not cut or frozen its dividend in recent memory, and with operating cash flow running at $667 million on a trailing basis, the financial backing for that consistency is clearly present.
Institutional ownership remains dominant, and average trading volume reflects a stock that is largely held by long-term investors rather than short-term traders. The low short interest further reinforces the view that the market does not see any near-term threats to the business model or the dividend commitment.
🌱 Dividend Growth and Safety
Cabot’s dividend history over the past three years tells a clear and deliberate story. The quarterly payout moved from $0.37 in early 2023 to $0.40 later that year, then stepped up to $0.43 in mid-2024, and most recently to $0.45 in May 2025. That trajectory represents growth of roughly 21.6% over approximately two and a half years, which is a respectable rate for a mature industrial business that also carries meaningful capital expenditure requirements.
The safety profile of this dividend is genuinely strong. Operating cash flow of $667 million covers the annual dividend obligation many times over, and even free cash flow of $291.6 million provides more than adequate coverage at the current payout level. The payout ratio of 31% against earnings of $5.72 per share leaves substantial room to absorb an earnings decline without forcing any change to the dividend. For investors who prioritize durability over yield magnitude, that kind of margin is exactly what to look for.
Cabot does carry debt on its balance sheet, and capital spending in areas like battery materials will continue to consume a portion of free cash flow. But with a profit margin of 8.62% and return on equity running at 21.82%, the company is generating returns well above its cost of capital, which supports the ongoing ability to both invest in growth and maintain a growing dividend. The trajectory here is not aggressive, but it is reliable, and reliability is precisely what dividend growth investors are paying for.
Chart Analysis
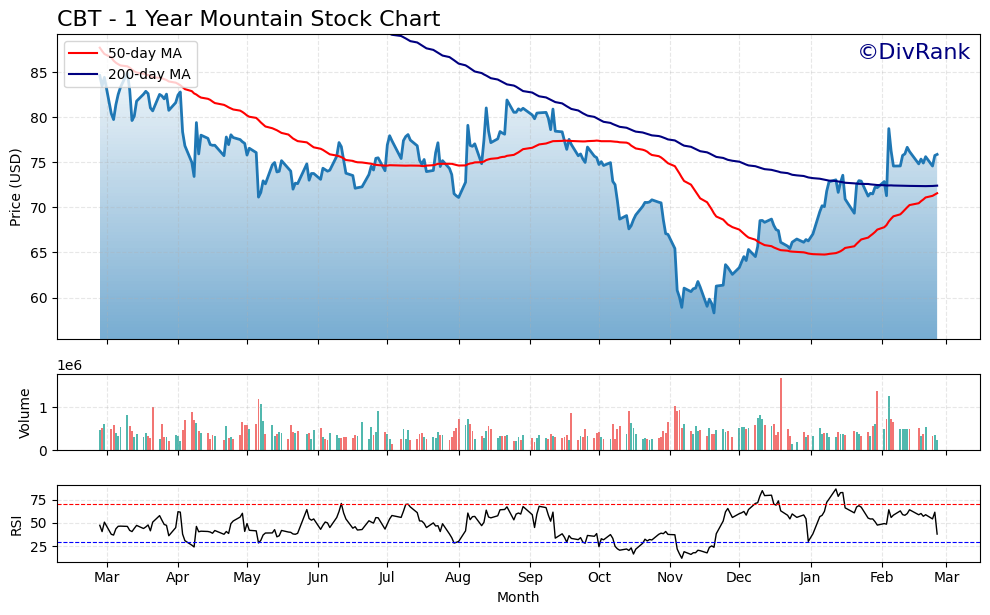
Cabot’s price chart over the past year tells a story of a stock that has worked hard to recover from a rough stretch, then pulled back from its highs. Starting the 52-week range with a low of $58.30, CBT mounted a steady climb that eventually reached $84.94 at the peak, a gain of roughly 46% from trough to top. The current price of $75.87 sits about 10.7% below that 52-week high, which suggests the stock has given back a meaningful portion of its advance but has not collapsed. For dividend investors, that kind of orderly retreat after a strong run is far less alarming than a breakdown driven by fundamental deterioration, and the distance of 30% above the 52-week low confirms that the broader recovery remains largely intact.
The moving average picture is mixed and deserves honest scrutiny. On the positive side, CBT is trading above both its 50-day moving average of $71.57 and its 200-day moving average of $72.41, which means the stock is holding above its medium and long-term trend lines on an absolute basis. However, the 50-day has crossed below the 200-day, forming what technicians call a death cross, a configuration that historically signals weakening momentum and can attract additional selling pressure. The spread between the two averages is relatively narrow, so this is not a severe divergence, but income investors should be aware that the technical backdrop is not cleanly bullish. A sustained move back above the mid-$80s would go a long way toward resolving this cross in a constructive direction.
The RSI reading of 38.16 adds another layer of context to the current setup. That figure sits just above the traditional oversold threshold of 30, indicating that selling pressure has been meaningful over the recent period but has not yet pushed the stock into deeply oversold territory. Momentum is clearly leaning to the downside, which aligns with the death cross signal and the retreat from the 52-week high. Historically, RSI readings in this zone for quality dividend payers can represent a setup where patient buyers begin to find value, particularly when the underlying business and payout remain sound.
For dividend investors, the chart presents a classic tension between an uncomfortable near-term technical setup and a price level that is materially more attractive than where CBT was trading less than a year ago. The stock is not in freefall, and the fact that it remains above both moving averages on an absolute basis provides some reassurance. Those with a long-term income orientation and an existing position may find the current level tolerable, while investors considering a new position might watch for the RSI to stabilize above 40 and for price to show some consolidation before committing fresh capital. The technical picture alone is not a reason to avoid CBT, but it does argue for measured entry sizing rather than aggressive accumulation at this exact moment.
Cash Flow Statement
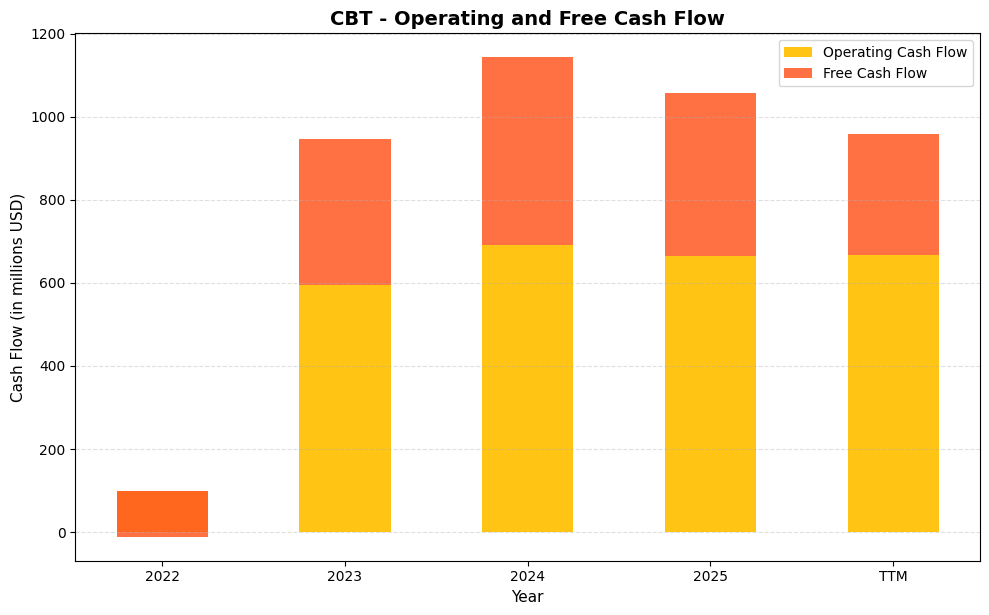
Cabot’s cash flow profile has undergone a dramatic transformation over the period shown, and the current trajectory supports dividend sustainability with considerable confidence. Operating cash flow surged from just $100.0 million in 2022 to $595.0 million in 2023, then climbed further to $692.0 million in 2024 before settling at $665.0 million in 2025 and a TTM reading of $667.0 million. Free cash flow tells an even more compelling story. The company posted a deeply negative free cash flow figure of $111.0 million in 2022, which reflected elevated capital expenditure demands at the time, but that figure flipped sharply to $351.0 million in 2023 and reached $451.0 million in 2024. The TTM free cash flow of $291.6 million, while modestly lower than the 2024 peak, still provides a comfortable cushion to fund the dividend and support ongoing capital return programs.
The trajectory from 2022 to present represents a fundamental shift in capital efficiency rather than a temporary cyclical uplift. The 2022 free cash flow deficit was a clear outlier driven by heavy spending, and the subsequent recovery revealed the underlying earnings power of the business once those investments cycled through. The spread between operating and free cash flow has remained relatively stable in recent years, indicating that capital expenditures have normalized to a sustainable maintenance and growth level rather than spiking again. For dividend investors, the consistency of free cash flow in the $291 million to $451 million range over the past three reported periods is what matters most, as it demonstrates the business generates genuine cash after investing in itself. With the dividend well covered by free cash flow at current payout levels, shareholders can view Cabot’s income stream as grounded in real cash generation rather than accounting-driven earnings.
Analyst Ratings
Analyst sentiment on Cabot Corporation is mixed as of late February 2026, with five analysts covering the stock and a consensus that does not lean firmly in either direction. The mean price target across the coverage group stands at $74.80, which is actually slightly below the current trading price of $75.87. That modest gap suggests the analyst community views the stock as fairly valued at current levels, with limited near-term upside priced into the consensus view.
The range of price targets tells a more nuanced story. The low target of $65.00 reflects a more cautious perspective, likely tied to concerns about industrial demand softness and the potential for margin pressure in the Reinforcement Materials segment if global manufacturing activity remains subdued. The high target of $85.00 represents a more constructive view, implying meaningful upside from current levels and reflecting confidence in Cabot’s specialty chemicals positioning and cash generation capacity.
With the current price sitting just above the mean target, the near-term setup is one of modest divergence between the stock’s actual trading level and where the analyst consensus thinks it belongs. That does not necessarily signal a sell, but it does indicate that further multiple expansion may require either an upside earnings surprise or an improvement in the broader industrial backdrop that lifts sentiment across the specialty chemicals space. For dividend investors focused on income and long-term compounding rather than near-term price appreciation, the current valuation is not a concern in isolation.
Earning Report Summary
Cabot Corporation has demonstrated steady operational performance on a trailing basis, with full-year results reflecting continued strength in its core business segments. The company reported earnings per share of $5.72 against revenue of $3.6 billion, translating to a net income of $306 million. The profit margin of 8.62% reflects a business that has maintained pricing discipline even as input costs and global demand conditions have created an uneven environment for specialty chemicals producers.
Performance Chemicals Drives the Quarter
The Performance Chemicals segment has continued to be a key contributor to Cabot’s earnings profile, supported by demand in specialty carbons and battery materials. Investment in higher-margin, innovation-driven product lines over the past several years has positioned this segment to benefit from secular growth trends in energy storage and advanced materials. Return on equity of 21.82% reflects the success of that capital allocation approach, as the business is generating strong returns on the assets deployed in these growth categories.
Reinforcement Materials a Mixed Bag
The Reinforcement Materials segment continues to face a mixed demand environment, with global tire production tied closely to automotive output and broader economic activity. While pricing dynamics and volume performance have held up reasonably well, the segment remains subject to cyclical pressures that can create quarter-to-quarter variability. Management has consistently demonstrated the ability to manage costs and protect segment EBIT even when top-line revenue comes under pressure, which speaks to the operational discipline embedded in this part of the business.
Solid Cash Flow and Shareholder Returns
Cabot continued its trend of solid cash generation, with operating cash flow of $667 million providing ample room to invest in the business while also rewarding shareholders. The dividend was increased to $0.45 per quarter in May 2025 and maintained at that level through the most recent payment in November 2025, reflecting management’s confidence in the durability of cash flows. Share repurchases have complemented the dividend as a return of capital mechanism, consistent with Cabot’s longstanding approach to balanced capital allocation.
Leadership Commentary and Outlook
Management has maintained a tone of controlled confidence heading into the balance of fiscal 2026, emphasizing the company’s ability to navigate macroeconomic uncertainty through its diversified portfolio and focus on specialty product lines. The ongoing investment in battery applications and performance additives is expected to be a source of incremental growth as those end markets expand. Cost discipline and working capital management remain central themes, and the combination of steady earnings and strong operating cash flow continues to support the company’s dividend and buyback commitments without stretching the balance sheet.
Management Team
Cabot Corporation is led by a deeply experienced executive team that brings a long track record in specialty chemicals and industrial materials. At the top is Sean Keohane, who has served as President and CEO since 2016. Keohane joined the company back in 2002 and has held key leadership roles across the organization, including President of the Performance Chemicals and Reinforcement Materials segments. His background includes management experience with global companies in manufacturing and technology, which has helped shape Cabot’s strategic direction.
Supporting him is Erica McLaughlin, who serves as Executive Vice President, Chief Financial Officer, and Head of Corporate Strategy. She has been with Cabot for over two decades and has rotated through a range of business and finance roles. Her insights into both the operational and strategic sides of the business give her a unique edge in guiding financial planning and execution.
The broader team includes Patricia Hubbard, Chief Technology Officer, who oversees innovation across material science and product development. Aaron Johnson brings extensive expertise to the company’s engineering, supply chain, and operations, while Bart Kalkstein leads the Reinforcement Materials segment and Cabot’s Americas region. Together, the team combines deep sector knowledge with an ability to adapt to market shifts and long-term industry trends.
Valuation and Stock Performance
Cabot’s stock is currently trading at $75.87, sitting near the middle of its 52-week range of $58.33 to $89.15. The pullback from the high end of that range reflects a combination of broader industrial sector caution and a market that has been selective about assigning premium multiples to specialty chemicals businesses in an uncertain macro environment. At current levels, the stock is trading modestly above the consensus analyst price target of $74.80, suggesting the market has priced in a fair amount of the fundamental value that the covering analysts identify.
From a valuation standpoint, Cabot’s price-to-earnings ratio of 13.26 represents a modest multiple for a business generating $5.72 in earnings per share with a return on equity of 21.82%. The price-to-book ratio of 2.52 against a book value per share of $30.16 is consistent with a business that earns well above its cost of capital, and the market cap of approximately $3.96 billion reflects a reasonably sized industrial compounder rather than a speculative position. These metrics collectively suggest a stock that is not cheap in absolute terms, but is not demanding a significant premium either.
Earnings per share of $5.72 against a stock price of $75.87 leaves room for valuation expansion if the industrial backdrop improves or if Cabot’s battery materials investments begin to generate more visible revenue contribution. Operating cash flow of $667 million on a market cap of roughly $4 billion translates to an operating cash flow yield of approximately 16.8%, which is a compelling number for income-oriented investors who look beyond the dividend yield to assess the underlying cash generation power of a business. The combination of a 13x earnings multiple, a 2.35% dividend yield, and a 31% payout ratio makes the current setup look reasonable for a long-term holder.
Risks and Considerations
Cabot’s business is sensitive to global economic cycles, particularly in the automotive and infrastructure sectors where its reinforcement materials play a large role. When industrial demand softens, revenue can come under pressure, and even though the company has done a good job protecting margins in recent periods, a prolonged slowdown in manufacturing activity could eventually weigh on earnings and free cash flow.
Raw material cost volatility is another factor worth watching. Feedstock pricing for carbon black can shift quickly, putting pressure on cost structures. Cabot typically passes these increases through to customers, but timing lags and competitive dynamics can create near-term margin compression that shows up in quarterly results before pricing adjustments take effect.
The company’s global operations introduce exposure to currency fluctuations, geopolitical instability, and evolving trade regulations. With manufacturing and sales distributed across multiple regions, a meaningful shift in trade policy or a regional demand disruption can create revenue headwinds that are difficult to offset quickly through other geographies.
Regulatory scrutiny around emissions and environmental standards remains an ongoing consideration for a business that produces carbon black and related materials. Compliance investment can be meaningful, and the direction of environmental policy in key operating jurisdictions adds a layer of uncertainty to longer-term capital planning.
Finally, while Cabot’s payout ratio of 31% and strong operating cash flow provide a comfortable cushion for the dividend, the gap between operating cash flow of $667 million and free cash flow of $291.6 million reflects elevated capital spending. If capex requirements increase further as the company scales its battery materials platform, free cash flow could tighten, which investors should monitor as the investment cycle evolves.
Final Thoughts
Cabot Corporation presents a straightforward and credible case for dividend growth investors at the current price. The combination of a 2.35% yield, a 31% payout ratio, and operating cash flow of $667 million creates a dividend that is well covered, growing at a measured pace, and backed by a business with genuine competitive advantages in specialty chemicals and emerging battery materials applications.
Valuation at 13.26 times earnings is not demanding for a company with a 21.82% return on equity and a track record of consistent cash generation. The stock’s current position near its 52-week midpoint and just above the analyst consensus price target of $74.80 suggests a market that is fairly pricing in the known risks without dismissing the long-term opportunity.
The risks are real, particularly around industrial cyclicality, raw material costs, and the capital intensity of the growth investment program. But Cabot has demonstrated the operational discipline to manage through those pressures while continuing to grow the dividend and maintain financial flexibility. For investors who value reliability over excitement, Cabot’s quiet consistency remains one of its most compelling attributes.