

Updated 2/25/26
Brown & Brown, Inc. (NYSE: BRO) is a nationwide insurance brokerage firm that has steadily grown into one of the top players in its industry. With a market cap of approximately $23.9 billion, the company offers a blend of consistent earnings, disciplined capital allocation, and a multi-decade track record of dividend growth. It’s led by a seasoned executive team focused on organic expansion and strategic acquisitions, including continued moves into international markets. The stock has pulled back considerably from its 52-week high, trading near the lower end of its range, which opens up a conversation about whether the current price offers a more reasonable entry point for long-term income investors.
Recent Events
Brown & Brown closed out its most recent fiscal year with revenue reaching approximately $5.76 billion, continuing the company’s multi-year trend of top-line expansion through both organic growth and bolt-on acquisitions. The company has remained active on the acquisition front, consistent with its long-standing strategy of broadening its footprint across commercial lines, employee benefits, and specialty insurance segments. Management has continued to emphasize disciplined deal selection, favoring transactions that add complementary capabilities rather than pursuing scale for its own sake.
The stock has experienced a meaningful correction from its 52-week high of $125.68, now trading around $70.05, a decline that stands in contrast to the company’s underlying financial performance. Net income came in at approximately $1.04 billion, and free cash flow reached nearly $1.40 billion, reflecting a business that continues to generate substantial cash well in excess of its dividend obligations. The compression in the stock price appears to reflect broader valuation re-rating across the financial services sector rather than any material deterioration in BRO’s core operations. Short interest stands at roughly 15.7 million shares, suggesting some market participants remain skeptical about a near-term recovery, though the business fundamentals tell a more constructive story.
On the dividend front, BRO raised its quarterly payment to $0.165 per share in November 2025, a step up from $0.15, continuing the company’s uninterrupted streak of annual increases. That consistency, paired with a payout ratio well below 20%, reinforces management’s commitment to rewarding shareholders without compromising financial flexibility.
Key Dividend Metrics
🪙 Forward Dividend Yield: 0.88%
📈 Annual Dividend: $0.63 per share
📅 Dividend Increase Streak: 30-plus consecutive years
🔒 Payout Ratio: 19.46%, leaving substantial room for continued growth
📆 Last Dividend Payment: $0.165 per share, paid February 4, 2026
🧮 Free Cash Flow Coverage: $1.40 billion in free cash flow far exceeds annual dividend obligations
📊 Recent Dividend Growth: Quarterly payment raised from $0.15 to $0.165 in November 2025
Dividend Overview
The dividend yield on BRO has ticked up to 0.88% as the stock has retreated from its highs, making it modestly more attractive on an income basis than it was a year ago. That said, anyone expecting a high-yield income stream from this name will need to recalibrate their expectations. The real value proposition here has never been about a fat starting yield. It has always been about consistency, growth, and the compounding effect of reliable annual increases over a very long period.
The payout ratio sits at just 19.46%, which means the company is retaining more than 80 cents of every dollar it earns. That level of conservatism is a deliberate choice, and it provides enormous headroom for continued dividend growth even if earnings growth temporarily moderates. The company isn’t stretching to fund its dividend, and that’s exactly the kind of foundation income investors should want to see.
Annual dividends total $0.63 per share at the current rate, against free cash flow of approximately $1.40 billion. The coverage is so deep that even a significant deterioration in earnings would leave the dividend well protected. For investors who prioritize safety and consistency over yield, that margin of safety is a meaningful attribute. The most recent increase, from $0.15 to $0.165 per quarter, was announced in November 2025 and took effect with the February 2026 payment, carrying forward the pattern of annual increases that has defined this company’s dividend history for over three decades.
Dividend Growth and Safety
BRO’s dividend growth record doesn’t attract the same attention as some higher-yielding names, but the underlying quality is difficult to dispute. The company has delivered annual increases through recessions, rate cycles, and periods of market stress, and the most recent hike from $0.60 to $0.63 annually continues that streak without interruption. The pace of growth has been measured rather than aggressive, which reflects management’s preference for sustainable increases over headline-grabbing jumps.
The safety of the dividend rests on several reinforcing factors. Free cash flow of $1.40 billion dwarfs the total annual dividend outlay, providing coverage that most dividend payers would envy. The business model itself is relatively defensive, as commercial insurance is not a discretionary purchase for most clients, which provides a degree of revenue stability that many industries can’t match. Operating cash flow reached $1.45 billion in the trailing period, further confirming that earnings quality is high and that reported profits are translating directly into spendable cash.
Return on equity came in at 11.23% and the profit margin stands at 18.29%, both reflecting a business that earns consistently and doesn’t need to take undue risks to generate acceptable returns. The payout ratio of just under 20% means management has significant latitude to continue raising the dividend at a rate that outpaces inflation, even without a step change in earnings growth. For investors building a long-term income portfolio, that combination of safety, coverage, and a growing base is precisely what makes BRO a name worth holding through periods of price volatility.
Chart Analysis
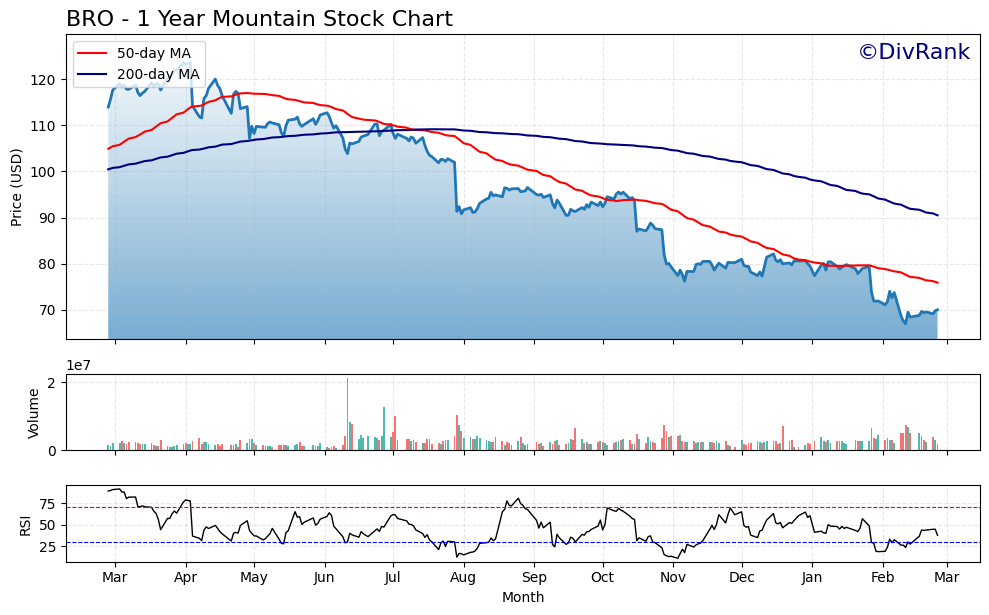
BRO has endured a significant drawdown over the past year, with shares falling from a 52-week high of $123.52 to a current price of $70.05, a decline of roughly 43% from peak levels. The stock is now trading just 4.52% above its 52-week low of $67.02, which tells you that price has been in a sustained and largely uninterrupted downtrend rather than experiencing the kind of choppy consolidation that sometimes precedes a recovery. For dividend investors accustomed to the relatively steady appreciation that insurance distribution businesses have historically delivered, this kind of price erosion is uncomfortable, and the technical picture does not yet offer much in the way of a convincing floor.
The moving average structure reinforces the bearish case. BRO is trading well below both its 50-day moving average of $75.91 and its 200-day moving average of $90.50, meaning the stock is sitting approximately 8% beneath the 50-day and more than 22% beneath the 200-day. The 50-day has also crossed below the 200-day, forming what technicians call a death cross, which is a configuration that signals deteriorating intermediate-term momentum and tends to attract additional selling pressure from trend-following institutional participants. Until price can reclaim the 50-day average in a meaningful way, the path of least resistance remains lower.
The RSI reading of 37.39 places BRO in oversold territory without quite crossing the conventional 30-level threshold that some traders use as a contrarian entry signal. This is a nuanced position because it suggests selling pressure is elevated and exhaustion may be approaching, but it does not yet represent the kind of deeply washed-out reading that has historically preceded sharp bounces in quality compounders. Momentum indicators of this nature can remain depressed for extended periods when a stock is repricing to a fundamentally lower earnings or valuation baseline, so the RSI alone should not be read as an all-clear.
For dividend investors, the chart presents a classic tension between valuation opportunity and technical deterioration. The proximity to a 52-week low and an oversold RSI may look attractive on the surface, but the death cross, the distance from both moving averages, and the absence of any visible base-building suggest that patience is warranted before treating current prices as a reliable entry point. Investors already holding BRO for its dividend income should focus on whether the underlying business fundamentals justify holding through this weakness, while new buyers would be prudent to wait for some stabilization in price action before adding exposure.
Cash Flow Statement
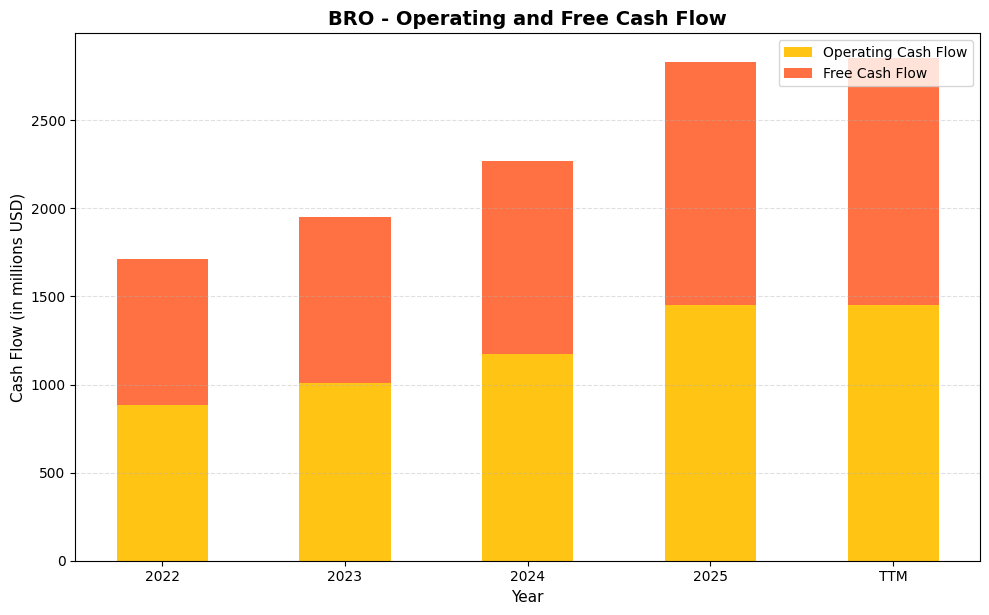
Brown & Brown’s cash generation has been on a remarkable upward trajectory, with operating cash flow climbing from $881.0 million in 2022 to $1,450.0 million in 2025, a gain of roughly 65% over just three years. Free cash flow has tracked nearly in lockstep, rising from $829.0 million to $1,382.0 million over the same period, which tells you that capital expenditure requirements remain minimal and that the business is not consuming its own growth. On a trailing twelve-month basis, free cash flow has reached $1,400.7 million, essentially matching the full-year 2025 figure and confirming that momentum has not faded. For dividend investors, this level of free cash flow generation relative to the company’s annual dividend obligation leaves an exceptionally wide margin of safety, meaning the payout is covered many times over without any strain on the balance sheet.
The consistency of the improvement is just as important as the magnitude. Each year in the data set produced a meaningful step up in both operating and free cash flow, with no dips or plateaus that might suggest the gains are lumpy or acquisition-driven in a one-time sense. The spread between operating cash flow and free cash flow has remained narrow throughout, hovering in the $50 million to $68 million range annually, which reflects a capital-light insurance distribution model that does not require heavy reinvestment in physical assets to sustain growth. That capital efficiency compounds the value of every incremental dollar of revenue BRO brings in, and it is precisely the kind of structural advantage that supports not just current dividend payments but the prospect of continued dividend increases for years ahead. Shareholders are effectively holding a business that converts a high fraction of its earnings into spendable cash, which is the most durable foundation a dividend growth story can have.
Analyst Ratings
The analyst community currently holds a consensus hold rating on BRO, with 14 analysts covering the stock. The average 12-month price target sits at $83.50, which implies meaningful upside of approximately 19% from the current price of $70.05. The range of targets spans from a low of $73.00 to a high of $100.00, reflecting a fairly wide dispersion of views on how quickly the stock might recover from its recent decline.
The low end of the target range at $73.00 is only modestly above the current price, suggesting that the more cautious analysts see limited near-term catalysts for a significant re-rating. The upper end at $100.00, by contrast, implies that a return toward prior valuation levels is possible if earnings momentum accelerates or if sentiment toward financial services broadly improves. The mean target of $83.50 lands comfortably in the middle, pointing to a view that the current price represents an overshoot to the downside relative to the company’s fundamental value. With the stock trading below every analyst’s price target, the consensus implies that the market has discounted BRO more aggressively than the underlying earnings and cash flow trajectory would justify, a setup that income-focused investors with a longer time horizon may find worth attention.
Earnings Report Summary
Strong Full-Year Fundamentals
Brown & Brown’s most recent full-year results reflect a business that has continued to expand at a healthy pace. Total revenue reached approximately $5.76 billion, a substantial increase over the prior year’s $4.8 billion and part of a sustained multi-year growth trajectory. Net income came in at roughly $1.04 billion, and earnings per share were $3.16, reflecting both the scale of the business and management’s ability to convert revenue growth into bottom-line results. The profit margin of 18.29% is consistent with the company’s historical efficiency profile.
Cash Generation Remains a Standout
Perhaps the most impressive aspect of the most recent financial period is the cash flow performance. Operating cash flow of $1.45 billion and free cash flow of nearly $1.40 billion represent a step change in the company’s cash-generating capacity, and both figures far exceed what is needed to fund the dividend at current levels. Return on assets came in at 4.24%, appropriate for a financial services business with a sizable balance sheet, while return on equity of 11.23% reflects disciplined capital management. The company’s acquisition activity has continued to add incremental revenue streams, and the integration of those deals into the broader platform has generally supported rather than pressured margins. Overall, the financial results paint a picture of a company executing consistently on a proven playbook, even as the stock price has disconnected from that underlying performance.
Management Team
Brown & Brown is led by President and CEO J. Powell Brown, who has held the role since 2009. Over the years, he has developed a reputation for long-term thinking and methodical execution. His leadership has been central to the company’s consistent organic growth while also overseeing an active acquisition strategy that has expanded the firm’s footprint both nationally and into international markets, including the Netherlands-based Quintes transaction completed in 2024.
Supporting him is Stephen P. Hearn, Executive Vice President and Chief Operating Officer, who brings deep industry experience and plays a crucial role in keeping day-to-day operations aligned with the company’s broader strategic priorities. R. Andrew Watts serves as Executive Vice President, CFO, and Treasurer, responsible for managing the firm’s financial strategy and ensuring a disciplined approach to capital allocation. Together, the leadership team combines strategic vision with operational focus, and their steady approach has been instrumental in building Brown & Brown into the reliable and consistently cash-generative enterprise it is today. The tone from the top emphasizes sustainable growth over short-term optimization, a philosophy that has served long-term shareholders well across multiple market cycles.
Valuation and Stock Performance
As of February 25, 2026, Brown & Brown is trading at $70.05, near the lower end of its 52-week range of $65.68 to $125.68. That represents a decline of roughly 44% from the stock’s peak reached earlier in the range, a move that stands in notable contrast to the company’s continued earnings and cash flow growth. The trailing P/E ratio has compressed to 22.17, and the price-to-book ratio sits at 1.88 against a book value per share of $37.34. Both figures represent a significant de-rating from the multiples the stock carried a year ago, when it traded at a trailing P/E above 33.
For valuation-conscious investors, the current setup is more interesting than it has been in some time. A P/E of 22 times for a business generating $1.40 billion in free cash flow with a 30-plus year dividend growth streak is a more reasonable proposition than the premium multiples BRO commanded at its highs. The beta of 0.79 reflects the relatively defensive nature of the underlying business, and the mean analyst price target of $83.50 suggests the market may have overcorrected to the downside. The market cap has fallen to approximately $23.9 billion, and with earnings per share of $3.16, the stock is now trading at a level that prices in considerably more pessimism than the company’s financial results would seem to warrant.
Risks and Considerations
Brown & Brown’s exposure to property and casualty lines means it is not entirely insulated from pricing cycles in the broader insurance market. If commercial insurance rates soften meaningfully, that could put pressure on commission revenue and compress margins, particularly in specialty lines where pricing dynamics have been most favorable in recent years. A sustained soft market would test the company’s ability to maintain its organic growth trajectory.
The company’s decentralized operating model gives individual offices considerable autonomy, which has served it well as a growth vehicle but introduces execution risk if standards are not consistently maintained across a much larger and more geographically diverse organization. As the acquisition pipeline remains active, integration execution will be worth monitoring, particularly for international deals where cultural and regulatory differences add complexity that domestic bolt-ons do not carry.
The sharp decline in the stock from its 52-week high raises a question that investors should take seriously: whether the market is pricing in something about the company’s earnings trajectory that is not yet fully visible in reported results. Short interest of roughly 15.7 million shares suggests a meaningful number of market participants hold a cautious view. While the fundamental case for BRO remains intact, the gap between the stock’s current price and its recent peak warrants continued attention to whether any shift in the competitive or macroeconomic environment is beginning to affect new business activity or retention rates.
Finally, the broader macroeconomic backdrop could influence demand for commercial insurance and related services. An economic slowdown that reduces business formation or compresses the insurable asset base would likely slow premium growth, which in turn affects the revenue base on which BRO earns its commissions. The company has demonstrated resilience across prior cycles, but it is not immune to the pressures that affect the broader financial services sector.
Final Thoughts
Brown & Brown stands out not because it makes headlines, but because it stays the course. Year after year, it posts steady results, quietly expands through smart acquisitions, and returns capital to shareholders without overreaching. The most recent dividend increase to $0.165 per quarter is a small but meaningful signal that management’s commitment to shareholder returns remains intact even as the stock has pulled back sharply from its highs.
At $70.05, the stock offers a more compelling entry point than it has in several years, with a P/E that has returned to a more reasonable level and a free cash flow yield that has expanded considerably alongside the price decline. The leadership is focused, the financials are solid, and the business model is repeatable. For investors who value consistency, measured growth, and financial discipline, Brown & Brown continues to offer a model of how steady execution can create lasting results, and the current price may be an opportunity to add to or initiate a position in a business that has earned its long-term track record.