

Updated 2/25/26
Founded in 1927, this single-branch bank in upstate New York has carved out a niche for itself through a conservative and disciplined approach. It leans heavily on investment-grade securities and maintains a traditional balance sheet that has stood the test of time. It doesn’t expand rapidly or tout growth at all costs. It simply generates earnings, supports a steady dividend, and manages risk like a seasoned pro.
The current stock price sits at $649.00, with a 52-week range between $435.75 and $649.45. That upward movement, representing nearly 49% appreciation over the past year, hasn’t come with any media fanfare, but it reflects quiet confidence in the bank’s operating model. For investors looking beyond the noise, that’s often a good sign.
Recent Events
Bank of Utica continues its tradition of operating without press releases, investor conferences, or earnings calls, so news flow from the company itself remains essentially nonexistent. What has been impossible to ignore, however, is the stock’s remarkable price performance. Shares have surged from a 52-week low of $435.75 to a current price of $649.00, reaching a new 52-week high in the process. That kind of move in a thinly traded, over-the-counter bank stock reflects a gradual but meaningful reassessment of the bank’s underlying value by a small but attentive investor base.
The dividend has continued to grow in its quiet, methodical fashion. The most recent payment of $9.75 per share, made on December 31, 2025, represents an increase from the prior year’s $9.50, extending the bank’s now well-established pattern of incremental annual increases. Combined with the June 2025 payment of $9.50, the full-year 2025 dividend totaled $19.25 per share, and the annualized forward rate now stands at $19.50. That’s not a headline-grabbing raise, but it is consistent, and in this business, consistency is the whole point.
The broader banking environment has continued to evolve, with regional institutions navigating a rate landscape that has shifted considerably over the past few years. Bank of Utica, with its heavy reliance on investment-grade securities rather than loan growth, remains somewhat insulated from credit quality concerns that have pressured other regional names. That defensive posture continues to be a defining characteristic of the institution.
Key Dividend Metrics
📈 Forward Dividend Yield: 3.00%
💵 Forward Annual Dividend Rate: $19.50
📅 Last Dividend Payment: December 31, 2025 ($9.75 per share)
📊 Payout Ratio: 23.44%
📈 5-Year Dividend Growth: from $15.50 annually (2020) to $19.50 annually (2026 forward)
💰 EPS: $79.98
Dividend Overview
Bank of Utica pays its dividend on a semi-annual schedule, with distributions in late June and late December each year. The forward annual rate of $19.50 per share represents a modest but meaningful step up from the $19.00 paid in 2024, and the yield on the current price of $649.00 works out to approximately 3.00%. That’s a somewhat lower yield than the stock offered when shares were trading in the $400s, but the compression reflects genuine price appreciation rather than any deterioration in the dividend itself.
The payout ratio of 23.44% against trailing EPS of $79.98 is one of the most compelling features of this income story. At less than a quarter of earnings, the dividend has an enormous cushion. Even a significant decline in profitability would leave the bank’s ability to pay the dividend essentially untouched. Many high-yielding financials survive on payout ratios north of 60% or 70%, which means any earnings stumble puts the dividend in jeopardy. That’s not a concern here.
The semi-annual payment structure, with distributions arriving at the end of June and the end of December, suits the bank’s traditional operating rhythm. Investors accustomed to quarterly income may need to plan accordingly, but the predictability of the schedule has been ironclad for years. There has been no history of cuts, no deferrals, and no surprises. That kind of reliability is genuinely rare.
Looking back at the dividend history, the trajectory is clear. The bank paid $7.75 in June 2020 and $8.25 in December 2020, establishing a full-year total of $16.00. Six years later, the annualized rate has grown to $19.50, representing cumulative growth of roughly 22% over that period. The pace is unhurried but entirely consistent.
Dividend Growth and Safety
The dividend history tells a story of disciplined, uninterrupted growth. Every single semi-annual payment since at least mid-2020 has matched or exceeded the prior comparable period. The June payments have progressed from $7.75 to $8.25 to $8.75 to $9.00 to $9.25 to $9.50, and the December payments have followed a nearly identical upward staircase, now reaching $9.75. That’s twelve consecutive payments with no reductions and no pauses. For a bank that operates without public scrutiny or analyst coverage, maintaining that record speaks to the strength of the underlying business.
Dividend safety at Bank of Utica is underpinned by the same conservatism that defines everything else the institution does. The bank does not aggressively grow its loan book, which means it avoids the credit cycle risks that have tripped up countless community banks over the decades. Its investment-focused balance sheet generates steady interest income without requiring the kind of risk-taking that leads to impairments and write-downs. With a Tier 1 leverage ratio that management has consistently kept well above regulatory minimums, there is no plausible near-term scenario in which the dividend would be at risk.
The EPS of $79.98 provides an almost extraordinary level of coverage for a $19.50 annual dividend. Even if earnings were to fall by 50%, the payout ratio would still sit below 50%, well within comfortable territory for most income investors. That margin of safety is what separates a truly reliable dividend from one that merely appears sustainable. Bank of Utica falls firmly in the former category, and the track record backs it up.
Chart Analysis
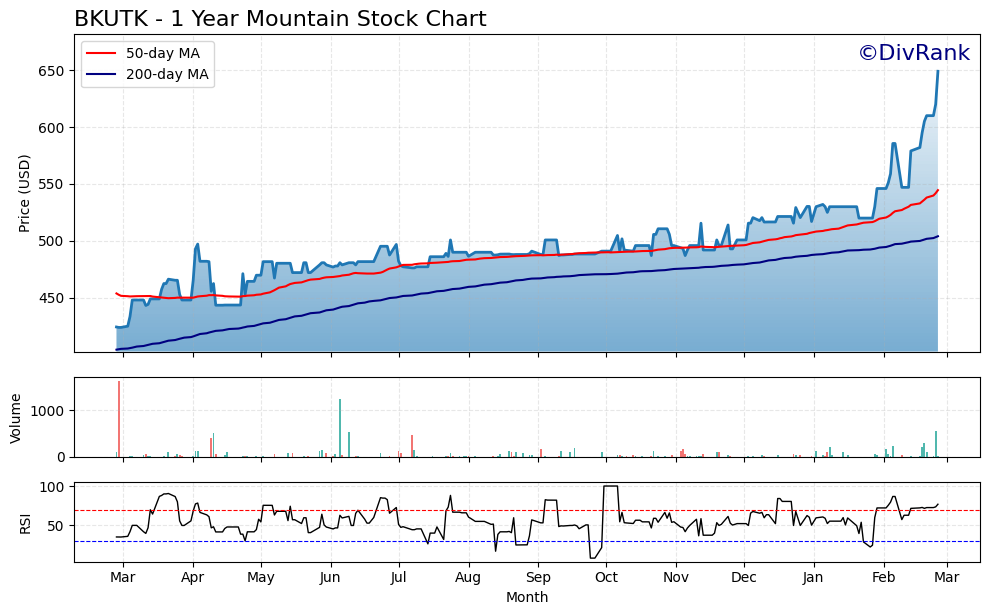
BKUTK has put together an impressive run over the past year, climbing from a 52-week low of $423.94 to its current price of $649.00, a gain of roughly 53% from trough to peak. What makes the current reading particularly striking is that the stock is sitting exactly at its 52-week high, meaning there has been no meaningful pullback to close out the most recent trading period. That kind of price action reflects sustained buying pressure rather than a brief speculative spike, and for a dividend-focused holding, it signals that the broader market has been consistently repricing the shares upward over a meaningful time horizon.
The moving average picture reinforces the bullish trend narrative. The 50-day moving average currently sits at $544.54 and the 200-day moving average at $504.05, with the stock trading well above both levels. The 50-day has crossed above the 200-day, forming what technicians refer to as a golden cross, a configuration that historically suggests the intermediate-term momentum is aligned with the longer-term trend rather than fighting against it. A stock trading nearly 19% above its 50-day average and nearly 29% above its 200-day average is showing genuine structural strength, though that same distance also means the stock has stretched considerably from its longer-term baseline.
The RSI reading of 76.93 places BKUTK firmly in overbought territory, above the conventional 70-level threshold. This does not mean the stock is due for an immediate reversal, as momentum names can remain overbought for extended periods during strong uptrends, but it does suggest that the risk of a near-term consolidation or modest pullback is elevated. Dividend investors who have held through the appreciation have been well rewarded, while those considering a new position at current levels should weigh the possibility that a better entry point may present itself if the RSI reverts toward more neutral ground in the weeks ahead.
For income-focused investors, the overall technical picture is one of genuine strength accompanied by short-term caution. The trend is clearly upward, the moving averages are constructively aligned, and the price is making new highs rather than deteriorating. The one flag worth monitoring is the extended RSI, which historically has preceded periods of sideways trading or brief retracements even in otherwise healthy uptrends. Investors who prioritize yield-on-cost and long-term dividend compounding may find the underlying trend encouraging, while those more sensitive to entry price and near-term volatility may prefer to wait for the momentum to cool modestly before adding exposure.
Cash Flow Statement
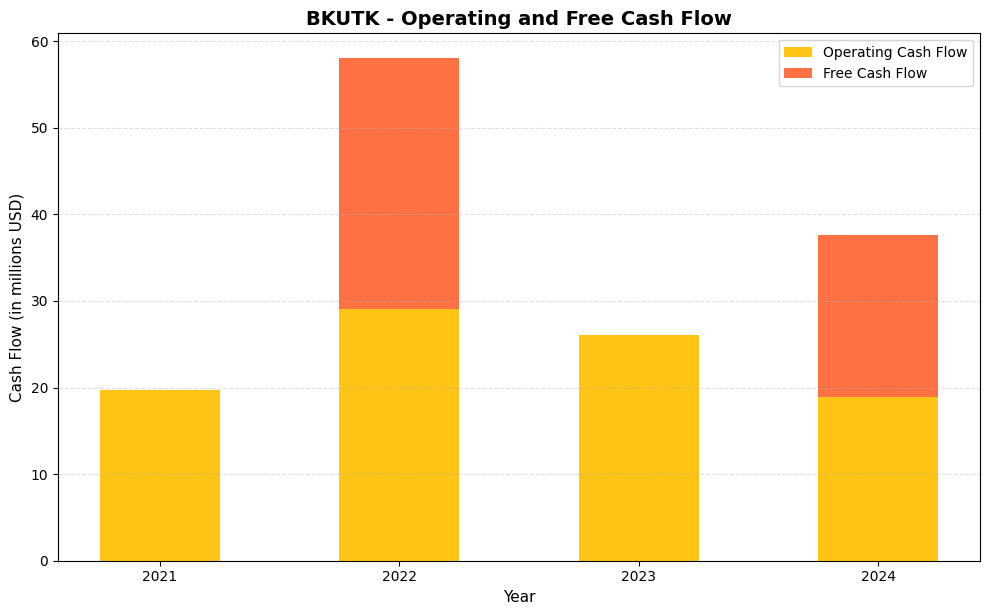
BKUTK’s operating cash flow has followed a somewhat uneven path over the four years on record, climbing from $19.7 million in 2021 to a peak of $29.0 million in 2022 before retreating to $26.1 million in 2023 and sliding further to $18.9 million in 2024. Free cash flow data is only cleanly available for 2022 and 2024, where it came in at $29.0 million and $18.8 million respectively, suggesting minimal capital expenditure requirements in those years and a business model that converts operating earnings into distributable cash with very little friction. The 2024 reading of $18.8 million in free cash flow is the figure that matters most for dividend sustainability, and while it represents a meaningful step down from the 2022 high, it still provides a foundation for covering distributions as long as payout levels remain disciplined relative to that baseline.
The broader trend here warrants honest attention from income investors. The four-year arc shows operating cash flow essentially returning to its 2021 starting point after a strong 2022 run, which raises fair questions about whether 2022 represented a one-time lift or a level the business can realistically recapture. On the more encouraging side, the near-perfect alignment between operating and free cash flow in the years where both figures are available points to very low capital intensity, meaning shareholders are not watching large portions of operating cash get consumed by reinvestment needs. For a dividend-focused holding, that capital efficiency is genuinely valuable, as it means free cash flow closely tracks operating performance without significant leakage. The priority for investors monitoring this name is whether operating cash flow stabilizes or continues to compress from here, since the dividend math gets progressively tighter if the 2024 level proves to be a new ceiling rather than a temporary trough.
Analyst Ratings
Bank of Utica continues to operate entirely without formal Wall Street coverage. No major financial institution has initiated research on BKUTK, and no consensus rating, price target, or formal recommendation exists in the traditional sense. That reality hasn’t changed and is unlikely to change, given the stock’s extremely limited float, low daily trading volume, and over-the-counter listing. With a market capitalization of approximately $164.9 million and an institutional investor base that is essentially nonexistent, there simply isn’t enough liquidity to attract the attention of sell-side research desks.
There are no recent analyst actions to report, no price target revisions, and no upgrade or downgrade activity. For most stocks, the absence of analyst coverage would be a meaningful negative signal. For Bank of Utica, it is simply a structural feature of the investment. The bank has never relied on analyst endorsement to validate its operating model, and long-term holders have not needed it either.
What the fundamentals do provide, in lieu of formal ratings, is a reasonably clear picture of intrinsic value. At a P/E ratio of 8.11 on EPS of $79.98, the stock is trading at a modest earnings multiple for a bank with a nearly pristine dividend track record and one of the strongest capital ratios in the sector. Investors who are comfortable doing their own work will find the financial statements far more informative than any sell-side note would likely be. For those who rely on third-party ratings, this remains a stock that requires a different kind of due diligence.
Earning Report Summary
Steady Results with a Familiar Approach
Bank of Utica’s most recent financial results are consistent with the long-standing pattern that defines this institution: methodical, conservative, and entirely predictable. EPS of $79.98 provides the clearest window into the bank’s earnings power, and it represents a strong foundation for the current dividend policy. With annual dividends totaling $19.50 per share against that earnings figure, the bank is retaining the vast majority of its profits, continuing to build equity capital at a disciplined pace. Net income generation continues to be driven primarily by interest income from the investment securities portfolio, which has been the core earnings engine for decades.
Operating expenses remain tightly controlled, which is a hallmark of a single-branch institution with no ambitions for geographic expansion. The bank’s cost structure is lean by design, and management has shown no inclination to change that. Non-interest income contributes very little to the total, which is entirely expected given the absence of fee-generating business lines. The result is a straightforward income statement that reflects exactly what the bank is built to do: generate steady net interest income, contain costs, and let earnings accumulate.
Balance Sheet Built for Stability
The balance sheet continues to reflect an institution that prioritizes capital strength above virtually everything else. The Tier 1 leverage ratio, which has historically been one of the highest in the sector, remains a defining feature of the bank’s financial profile. Total assets have grown gradually over recent years, supported by deposit growth and retained earnings rather than leverage. Net loans and leases remain a small fraction of the asset base, underscoring the bank’s preference for investment securities over credit risk.
Equity capital continues to build, which is the natural outcome of a payout ratio below 25% and consistently profitable operations. That growing capital base is precisely what gives management the confidence to raise the dividend incrementally each year, even in the absence of dramatic earnings growth. The balance sheet is not designed to maximize return on equity. It is designed to ensure the institution never faces a capital constraint, and on that measure, Bank of Utica continues to succeed.
All in all, the latest results confirm a financial institution that knows exactly who it is. It is not chasing trends or competing with larger regional banks on growth metrics. Bank of Utica continues to offer a picture of calm, methodical banking, something that income-focused investors can genuinely appreciate in a market environment that rarely rewards patience.
Management Team
Bank of Utica has always taken a different approach to leadership. It is not run by executives chasing quarterly growth targets or positioning for the next media splash. This is a closely held institution, with a long-standing family legacy at the helm and a management team that clearly values consistency over flash. That sense of continuity is a significant part of what has made the bank such a stable operator over nearly a century of operation.
The leadership team has a clear strategy: focus on risk-averse investing, keep lending conservative, and maintain a strong capital buffer. That strategy has not wavered, and the results speak for themselves. There is no high turnover, no sudden pivot in business model, and no signs of the kind of managerial ambition that tends to introduce unnecessary risk into otherwise stable institutions. With one of the strongest Tier 1 leverage ratios in the sector, the people in charge are unambiguously prioritizing financial strength over aggressive expansion. It is not about being the biggest. It is about staying strong, dependable, and profitable over the long term, and after decades of doing exactly that, there is no reason to expect anything different.
Valuation and Stock Performance
At a price of $649.00, BKUTK is trading at a P/E ratio of 8.11 based on EPS of $79.98. That is a modest earnings multiple for any bank, let alone one with no credit quality concerns, a payout ratio below 25%, and a dividend track record that has not seen a single cut or pause in recent memory. The absence of current price-to-book data makes a direct asset-based comparison difficult, but the earnings-based valuation alone suggests the stock is not expensive relative to the quality of the underlying business.
The stock’s 52-week performance has been exceptional by any standard. Shares moved from a low of $435.75 to the current price of $649.00, representing appreciation of nearly 49%. That kind of return in a single year from an obscure over-the-counter bank stock is unusual, and it raises the natural question of whether the opportunity has passed. At current levels, the forward yield of approximately 3.00% is lower than it was when shares were in the mid-$400s, but the P/E ratio still sits in single digits, which is not a valuation that suggests reckless overpricing.
The stock is now trading essentially at its 52-week high, which means momentum and fundamentals are aligned. For existing holders, that’s a satisfying position to be in. For prospective buyers, the more honest framing is that the margin of safety is narrower today than it was a year ago. The dividend remains well-covered, the business model remains sound, and the valuation remains reasonable, but the deep discount that characterized earlier entry points has narrowed considerably. The income story is still intact, even if the upside from pure valuation re-rating is less obvious at $649 than it was at $480.
Risks and Considerations
Liquidity remains the most practical risk for anyone considering a position in BKUTK. The stock trades over the counter with very limited daily volume, and the small float means that even modest buying or selling pressure can move the price meaningfully. Building or exiting a position of any significant size requires patience and careful execution, and investors accustomed to the liquidity of exchange-listed stocks may find the experience frustrating.
Transparency is another factor that requires acknowledgment. Bank of Utica does not host earnings calls, issue press releases, or provide forward guidance. Financial data is available but requires more active effort to locate and interpret than is the case with publicly listed peers. For investors who depend on regular management communication to assess the health of their holdings, this bank demands a higher degree of comfort with limited information flow.
The bank’s concentrated reliance on investment securities as its primary earnings engine creates meaningful sensitivity to interest rate movements. If rates were to decline sharply and stay low for an extended period, reinvestment yields on maturing securities would compress, and net interest income could come under pressure. The conservative capital structure provides a meaningful buffer, but the rate sensitivity is a genuine consideration rather than a theoretical one.
The annual dividend structure, now a semi-annual structure, still requires planning for investors who depend on regular income. Payments arrive in late June and late December, which means there are extended periods between distributions. For investors managing cash flow needs on a monthly or quarterly basis, that rhythm requires some adjustment. Finally, the current price near the 52-week high means the stock no longer offers the same valuation cushion it did a year ago, and any disappointment in earnings or a broad market sell-off could see shares give back a meaningful portion of recent gains.
Final Thoughts
BKUTK offers something increasingly rare in today’s market: a steady, predictable business model that has not changed meaningfully in decades. It is not chasing trends or reinventing itself every cycle. Instead, it sticks to what it knows, managing risk, building capital, and paying a reliable and growing dividend. The most recent payment increase to $9.75 per share continues a streak that has seen the semi-annual payment rise in every period since at least mid-2020, and the forward annual rate of $19.50 reflects a business that is incrementally rewarding patient shareholders.
The share price surge of nearly 49% over the past twelve months is worth celebrating, but it also changes the risk-reward profile for new investors. The yield at $649 is approximately 3.00%, which is lower than historical averages for this stock, and the deep price-to-book discount that once made the valuation case almost self-evident is less clearly defined today. The P/E ratio of 8.11 still suggests reasonable value, but the easy money from re-rating has likely been made.
For long-term holders, the thesis remains compelling. The business is sound, the dividend is growing, the payout ratio is conservative, and management has given no indication of any desire to change what is clearly a working formula. For new investors, the current entry point requires accepting a lower starting yield and a narrower margin of safety than existed a year ago, which is a fair trade only for those with genuine patience and a long time horizon.
Bank of Utica is not a flashy name, and that is exactly the point. It operates quietly, raises its dividend steadily, and manages its capital with rare discipline. In a market full of overstimulation, this is a stock that continues to offer a welcome return to simplicity.