

Updated 4/11/25
Bank of America has had its share of ups and downs lately. With the stock recently trading around $35.13—down about 2% on the day—it’s clear investors are still adjusting to a shifting interest rate environment and broader economic signals. Big banks like BAC tend to ride the waves of macro trends more than most, and right now, that wave is all about where the Fed is heading next and how credit markets are holding up.
Over the last year, BAC’s market cap has bounced between $266 billion and north of $330 billion. That kind of swing shows just how much sentiment and expectations drive valuation here. But underneath that, the company has been delivering solid results. Earnings have popped year-over-year, up more than 100% in the latest quarter. And revenue is holding strong, now hovering around $96 billion on a trailing basis.
Not everything is perfect—operating cash flow was in the red—but the core strength of the business hasn’t really wavered. BAC still has one of the most resilient balance sheets in the sector, and that matters a lot when you’re evaluating the safety and sustainability of its dividend.
Key Dividend Metrics
💵 Forward Annual Dividend Rate: $1.04
📈 Forward Dividend Yield: 3.02%
🔁 Trailing Dividend Yield: 2.79%
📊 Five-Year Average Yield: 2.44%
💡 Payout Ratio: 31.15%
📅 Next Dividend Date: March 28, 2025
🚫 Ex-Dividend Date: March 7, 2025
Dividend Overview
Bank of America has quietly become a core holding for a lot of dividend-focused investors. That 3% forward yield doesn’t scream for attention, but it stands out when you stack it against the broader market. It’s also a good step up from BAC’s own five-year average of 2.44%, hinting that the stock may be offering more value than usual.
More important than the headline yield is the structure behind it. BAC keeps its dividend strategy conservative. The company isn’t stretching itself thin to please shareholders—it’s paying out just about 31% of its earnings. That leaves plenty of room for future growth or protection if earnings take a temporary dip.
Another detail that supports the current setup is how fairly the stock is priced. Trading right at book value, BAC doesn’t look overly expensive, which helps provide some downside cushion. It means investors are getting paid a solid yield without having to overpay for it.
The management team at BAC seems focused on balance—keeping the dividend steady, supporting long-term growth, and making sure the business remains on strong footing. There’s a quiet confidence in their approach, which fits nicely for investors who want predictable income without constant surprises.
Dividend Growth and Safety
While Bank of America isn’t exactly a dividend growth darling, it has been moving in the right direction. After the drastic cut during the financial crisis, the company has gradually rebuilt its dividend. It now pays $1.04 annually, up from $1.00 just a year ago. That’s a modest 4% increase, but it’s meaningful when combined with a low payout ratio and solid earnings.
The safety of the dividend is where BAC really shines. The bank is sitting on nearly $749 billion in cash—yes, billion—and that’s more than its total debt. That kind of cash cushion isn’t common in the corporate world, and it offers a layer of security that’s hard to match.
Profitability metrics also back up the dividend’s durability. Return on equity sits at over 9%, and the operating margin is just shy of 30%. Those are strong figures that show BAC is earning well on its capital, even in a complex environment.
For investors who care about getting paid consistently, BAC offers peace of mind. The dividend isn’t flashy, but it’s built on a foundation that’s designed to withstand volatility. And with the bank continuing to reduce share count through buybacks, the value of each dividend dollar becomes a little more meaningful over time.
Cash Flow Statement
Bank of America’s trailing twelve-month cash flow statement paints a mixed picture. Operating cash flow turned negative at -$8.8 billion, a sharp reversal from the $45 billion in positive cash flow the year prior. This drop may raise eyebrows, especially considering that consistent cash from operations is typically a hallmark of stability. However, this dip doesn’t necessarily reflect operational weakness—it’s largely tied to changes in working capital and the mechanics of how banks account for cash movements.
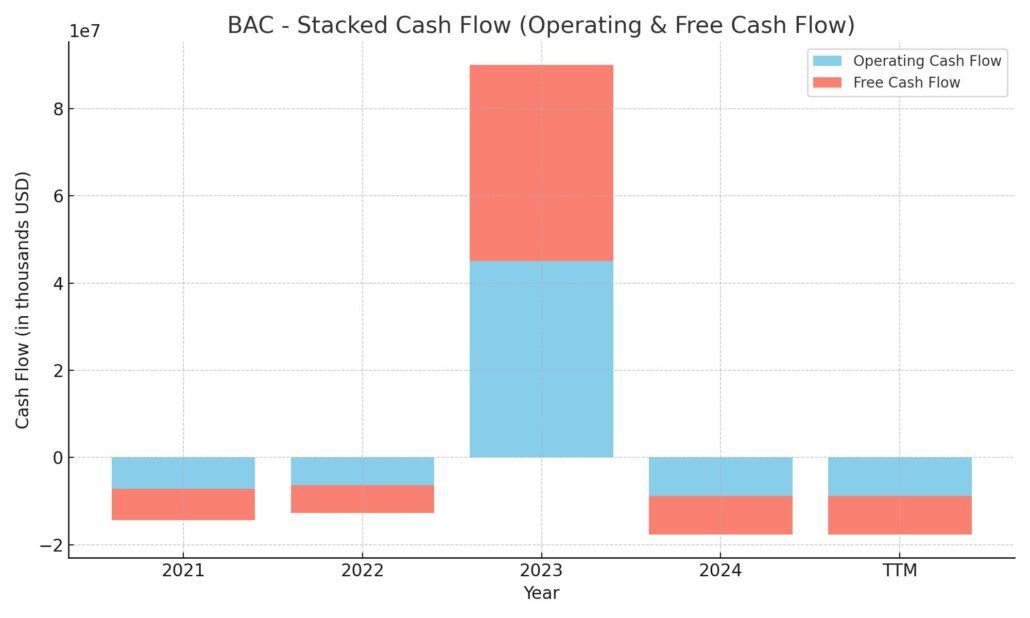
On the investing side, the outflow ballooned to over $90 billion, nearly triple what it was in 2023. This kind of heavy investing is often seen in the financial sector when institutions reposition their securities portfolios or make long-term strategic moves. Financing cash flow, on the other hand, came in positive at $60 billion, largely driven by new debt issuance, which totaled nearly $57 billion, partially offset by $70 billion in repayments and $18 billion in stock buybacks. Even with the volatility, the bank ended the period with $290 billion in cash—a very strong liquidity position that provides flexibility moving forward.
Analyst Ratings
📈 Bank of America has recently caught the attention of analysts following a notable decline in its stock price. Morgan Stanley upgraded the stock from “equal-weight” to “overweight,” citing its attractive valuation and robust balance sheet. The stock is currently trading at just eight times the firm’s 2026 earnings projection, which is considered low for a bank of its size and stability. Additionally, an expected return on equity of 11% adds to its appeal.
📊 The consensus among analysts reflects a positive outlook for Bank of America. The average 12-month price target stands at $50.97, with estimates ranging from a low of $43.50 to a high of $59.00. This suggests a potential upside of over 42% from the current trading price.
🏦 Despite broader concerns in the banking sector, Bank of America’s strong fundamentals and conservative management approach have positioned it favorably among its peers. Analysts appreciate the bank’s focus on responsible growth and its ability to maintain high loan quality, even in uncertain economic conditions.
Earning Report Summary
Strong Finish to 2024
Bank of America wrapped up the year on a high note, posting fourth-quarter net income of $6.7 billion, or $0.82 per share. That’s a big step up from the same quarter last year when earnings came in at just $0.35 per share. Revenue also impressed, coming in at $25.5 billion—up 15% from a year ago. This kind of growth helped ease concerns about the broader financial sector and showed the bank is still finding ways to grow in a challenging environment.
One standout area was trading. The bank’s trading division notched a record $4.1 billion in revenue for the quarter, making it the 11th straight quarter of growth in that segment. Investment banking also pulled its weight, with fees climbing 44% to $1.7 billion. Net interest income came in at $14.4 billion, up 3% from the prior year, and management expects that number to move higher into next year, somewhere between $15.5 billion and $15.7 billion by the fourth quarter of 2025.
Consumer Banking and Wealth Growth
On the consumer side, things stayed solid. Deposits continued to climb for the sixth quarter in a row, and people spent more too—debit and credit card activity was up 5%. The wealth management arm had a strong year as well, bringing in 24,000 new households and pushing total client balances to a staggering $6 trillion. Asset management fees got a nice bump too, growing by 23% year-over-year.
Bank of America’s balance sheet remains one of the sturdiest in the industry. The bank ended the year with $953 billion in liquidity and $201 billion in CET1 capital. That translates to a CET1 ratio of 11.9%, which is right in the comfort zone regulators and investors like to see.
Shareholders were treated well in 2024. The bank returned $21 billion to them through a combination of buybacks and dividends, including an 8% boost to the dividend itself. CEO Brian Moynihan emphasized that the company continues to lead in deposit and loan growth, and he sounded confident about what’s ahead in 2025. All in all, it was a strong report that showed both resilience and momentum.
Chart Analysis
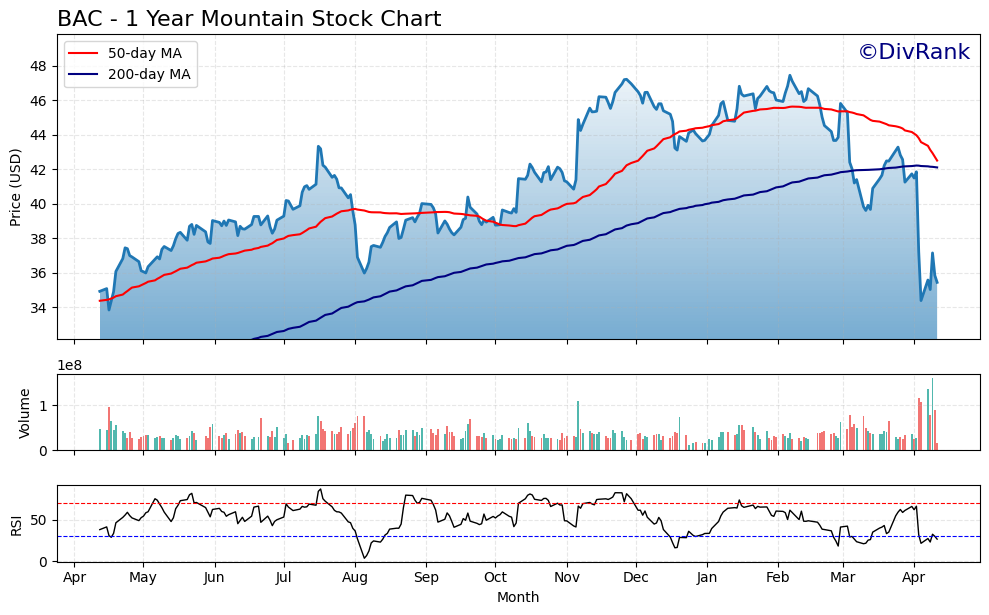
Price and Moving Averages
The chart for BAC over the past year shows a fairly classic cycle. After starting the period near the $34 mark, the stock gained steady traction and peaked around $48 before rolling over. The red line, representing the 50-day moving average, tracked closely with the price for most of the climb and then started to decline sharply in the last few months, diverging below the 200-day moving average (blue line). That crossover in early April is a bearish technical signal, often indicating a potential trend shift or deeper pullback.
The price has now slipped well below both moving averages. It tried to bounce off the lows but is still sitting at the lower end of the year’s range. This kind of action signals a breakdown in momentum. A sustained move back above the 200-day average would be an encouraging sign, but until then, the chart is telling a story of pressure and uncertainty.
Volume Patterns
Volume adds another layer here. There’s been a noticeable spike in trading volume during the recent sell-off, especially around the steep drop in early April. That surge usually means strong institutional activity—either exiting or rebalancing. It’s not just a quiet drift lower. Investors were active, and the selloff had conviction behind it.
Earlier in the year, volume was more balanced, with no major surges even during the rally into the mid-40s. That lack of high-volume buying during the climb might explain why the stock didn’t hold those higher levels.
RSI and Momentum
Looking at the Relative Strength Index (RSI) at the bottom of the chart, it’s been trending under the neutral 50 level for a few weeks now. In March and April, it dipped close to the oversold zone below 30 before bouncing. These bounces from oversold conditions tend to draw in shorter-term interest, but they don’t always signal a long-term reversal.
Back in mid-2023, the RSI spent more time above 70, signaling overbought territory. That was during the uptrend that saw the stock hit its peak. Since then, momentum has clearly shifted down, and unless RSI can sustain a break back above 50, the short-term trend will remain under pressure.
Overall Impression
The recent breakdown below both moving averages, paired with a high-volume selloff and weak momentum, suggests BAC is going through a correction phase. It’s lost the technical support it built last year, and it hasn’t yet shown strong signs of a reversal. While the fundamentals may be intact, the chart reflects a market still adjusting its expectations.
Management Team
Bank of America’s leadership is anchored by Brian Moynihan, who has held the CEO role since 2010. Over the years, his approach has leaned heavily on what’s been described as “responsible growth,” with a focus on risk discipline, long-term strategy, and operational efficiency. Under his guidance, the bank has navigated a series of complex cycles—economic downturns, rate shifts, and evolving regulatory environments—without drifting too far off course.
Supporting Moynihan is a deep bench of experienced executives. Alastair Borthwick serves as Chief Financial Officer and plays a central role in managing the firm’s financial structure, especially around interest rate management and capital returns. Dean Athanasia, overseeing regional banking, brings focus to consumer and small business operations. Sheri Bronstein, the Chief Human Resources Officer, has helped shape a workplace culture centered on inclusion, employee development, and retention. Each member of the leadership team brings stability to the table, which is particularly valuable in the current environment.
Valuation and Stock Performance
Bank of America’s stock has seen a fair amount of movement in recent months. Most recently trading near $35.85, the share price sits well off its 52-week high of $48.08. The pullback, while meaningful, hasn’t come with major surprises in earnings. In fact, the company continues to generate consistent profits and return capital to shareholders.
From a valuation standpoint, the stock trades at a forward price-to-earnings ratio of about 9 to 10, depending on the earnings projection used. That puts it on the lower end compared to some peers in the financial sector. Return on equity sits near 11%, which points to solid capital efficiency, especially for a bank of this size. While the stock’s performance over the past year may not have delivered fireworks, its current price could represent a reset rather than a decline in underlying quality.
Analyst sentiment remains cautiously optimistic. The consensus 12-month price target is around $51.82, which implies a notable potential upside from current levels. That said, recent price action has shown that sentiment can turn quickly, especially when macro factors like interest rate outlooks or regulatory comments shift the narrative.
Risks and Considerations
There are a few important risks to keep in mind. First, the interest rate environment remains a major lever. If rates stay elevated longer than expected or if the yield curve continues to compress margins, it could weigh on net interest income. That would impact the bank’s profitability, particularly on the lending side.
Economic slowdowns or credit events could also challenge the bank’s loan book. Higher default rates and credit losses would put pressure on earnings, and while the bank has reserves, prolonged stress across the economy can still sting. Regulatory scrutiny is another wildcard. Any tightening of capital requirements or changes to fee structures could squeeze revenue lines, especially in areas like investment banking or consumer services.
There’s also the broader market narrative to consider. Bank stocks have been under pressure generally, and sentiment shifts fast. Even if fundamentals remain sound, market perception can lag or disconnect entirely. Investors should be prepared for that mismatch from time to time.
Final Thoughts
Bank of America finds itself in a familiar spot: steady fundamentals, strong capital, and a leadership team that knows how to navigate volatility. The current share price reflects caution in the market, but not necessarily weakness in the business itself. While risks remain—from economic softness to potential regulatory headwinds—the structure is in place for long-term performance.
Management continues to focus on cost control, shareholder returns, and smart capital deployment. That’s not always the stuff of headlines, but it’s what gives a company staying power. For investors who value consistency and don’t mind waiting through short-term chop, this is the kind of name that can anchor a portfolio without needing to reinvent itself every quarter.