

Updated April 2025
Winnebago Industries isn’t just another RV brand—it’s practically woven into the fabric of American road trips. Since the late 1950s, the company has evolved from building trailers in Iowa to owning a suite of recognizable names in the RV and marine spaces. Think Grand Design, Newmar, and Chris-Craft. It’s a mix that gives Winnebago reach across land and water, and a level of brand diversity that isn’t always obvious at first glance.
Lately though, the ride has been bumpy. With the stock sitting around $33—down almost 50% in the past year—investors are clearly cautious. But when you look at Winnebago through the lens of income rather than momentum, a different story starts to unfold. This is a company with a meaningful dividend yield, a history of raising its payout, and some real strengths in free cash flow. Let’s unpack what’s happening right now and what it means if you’re looking at WGO from a dividend perspective.
Recent Events
The past year has been all about economic pressure. Rising interest rates and cooling consumer demand have hurt big-ticket discretionary categories like RVs. Winnebago’s top line reflects that slowdown—sales have fallen nearly 12% year over year. And bottom-line numbers show the squeeze more clearly: net income has dipped into negative territory, with a trailing twelve-month loss of about $5.7 million.
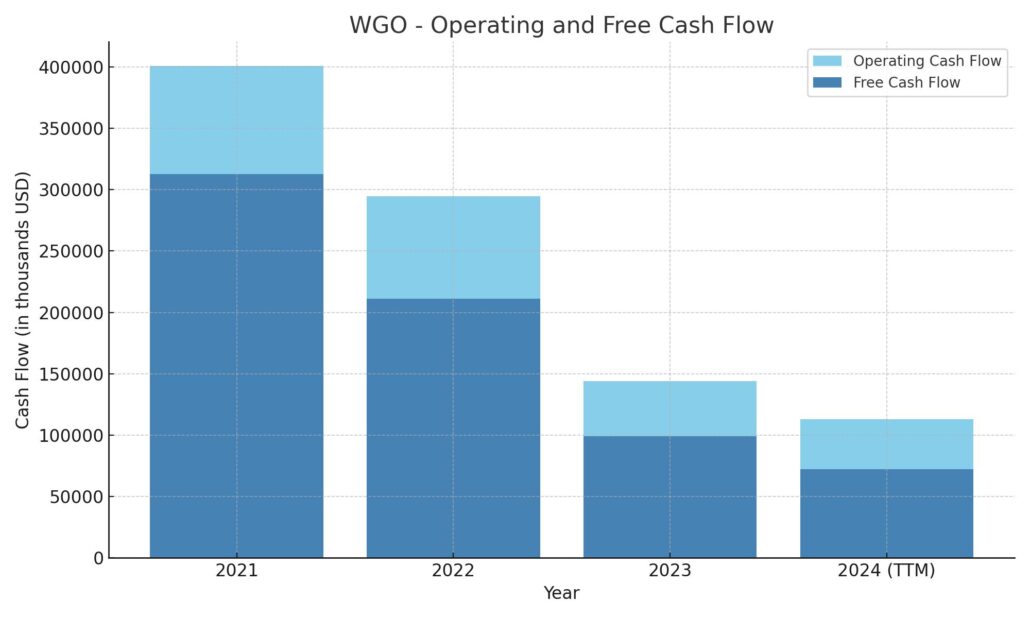
Still, some of the underlying fundamentals are holding up better than the earnings might suggest. Operating cash flow came in at roughly $113 million over the past year, and free cash flow was a respectable $67 million. That’s meaningful in a tough year.
Valuation has come back to earth as well. The price-to-book ratio now sits below 1.0, which usually signals that the market sees more risk ahead. At the same time, the forward P/E is hovering around 13x—neither screaming value nor looking expensive. Just quietly waiting for a clearer signal.
One number that jumped out? Short interest. Nearly 20% of the float is sold short, which hints at how many investors are betting against a near-term recovery. That can either be a warning or an opportunity depending on how things shake out in the next couple of quarters.
Key Dividend Metrics
🪙 Forward Dividend Yield: 3.79%
📅 Ex-Dividend Date: April 16, 2025
📈 5-Year Average Yield: 1.42%
📉 Payout Ratio: 281.82%
💸 Trailing Dividend Per Share: $1.30
🧾 Next Payment Date: April 30, 2025
⚙️ Free Cash Flow (TTM): $67.2 million
🧰 Operating Cash Flow (TTM): $112.9 million
📚 Book Value Per Share: $43.44
Dividend Overview
One of the first things any income investor will notice here is the yield. At nearly 4%, Winnebago is offering a payout that’s well above its historical average. That kind of yield usually shows up in one of two situations—either a company is aggressively growing its dividend, or the stock price has taken a hit. In this case, it’s a bit of both.
Even as earnings have softened, the company has stayed committed to its dividend policy. The annual payout has climbed steadily over the past few years, rising far faster than earnings during the good times. Now, with pressure on the income statement, the question is whether that pace can continue.
The payout ratio is elevated—no question. At over 280%, it’s way above what most would consider a safe zone if you’re looking purely at net income. But that’s not the full picture. Dividends are paid in cash, not accounting profits. And Winnebago still throws off enough free cash flow to cover the dividend with room to spare. There’s no sign of strain yet, but if cash flow begins to slip, the margin of safety could narrow quickly.
The other thing to watch is the company’s capital allocation posture. Does it start conserving more cash in response to weak earnings? Or does it continue supporting the dividend to signal confidence in a rebound? That call could come into sharper focus depending on how the next few quarters shape up.
Dividend Growth and Safety
Here’s where things get interesting. Winnebago has quietly become a solid dividend grower. Over the past five years, the annual dividend has more than doubled. The company clearly sees its dividend not just as a reward to shareholders, but as part of its long-term strategy to attract steady-handed investors who value consistency.
The balance sheet gives some breathing room. With a current ratio over 2.0 and debt-to-equity below 53%, the company has flexibility. It’s not overly leveraged, and it’s got enough cash—about $115 million—to handle short-term needs. That said, leverage is higher than it was in past cycles, particularly after a string of acquisitions. That’s not a red flag, but it does reduce the wiggle room if cash flow starts to weaken.
Insider ownership is modest, around 3.4%, but institutional holders are very active—over 114% of the float. That tells you the stock is on a lot of radar screens, and that institutional investors are likely to expect continued discipline when it comes to managing the dividend.
Short-term, the elevated payout ratio is something to monitor closely. If cash flow holds up, the dividend can remain in place even if reported earnings stay weak. But if both earnings and cash generation take another leg down, pressure could build to reduce the payout.
Still, this isn’t a company in structural decline. RVs are a cyclical market, and right now we’re in a down leg. That won’t last forever. When demand picks back up, Winnebago’s margins and earnings power are likely to follow. And for long-term investors, that can make the current yield more attractive—provided there’s confidence in the company’s ability to bridge the gap.
Cash Flow Statement
Over the trailing twelve months, Winnebago generated $112.9 million in operating cash flow, a noticeable decline from the $294.5 million reported in fiscal 2022 and a sharp drop from the $400.6 million seen in 2021. This downtrend reflects pressure from both softer demand in the RV market and margin compression. Despite the weaker inflow, the company still managed to produce $72.3 million in free cash flow after accounting for $40.6 million in capital expenditures. While reduced from prior years, that level of free cash flow still supports ongoing dividend payments and provides some room for financial flexibility.
Investing activities were relatively modest, with outflows of $35.6 million, primarily tied to capital investments, and no significant acquisitions or asset sales. Financing cash flow, on the other hand, was deeply negative at -$227.5 million. That reflects both debt repayments and ongoing share repurchases, including $83.9 million returned to shareholders through buybacks. The end cash position now stands at $115.5 million, down from over $330 million a year ago, suggesting management has leaned on cash reserves to support capital returns while navigating through a challenging demand environment.
Analyst Ratings
📊 Winnebago Industries has recently seen adjustments in analyst ratings, reflecting shifting perspectives on its financial trajectory. 🧭 The general consensus leans toward a “Moderate Buy,” with an average price target landing around $56.89. 🎯
⬆️ In March 2025, KeyBanc Capital Markets upgraded the stock to “Overweight” and bumped the price target to $58. This was driven by optimism around potential market share gains and improved operating efficiency, particularly as the company leans into higher-margin segments and tightens cost structures.
🔻 On the flip side, Citigroup revised its target downward from $51 to $43 during the same month, though it maintained a “Buy” rating. The reason? Softer consumer demand in the RV segment, which they believe may weigh on near-term performance despite the company’s longer-term appeal.
📉 DA Davidson also trimmed its price target to $54, pointing to similar concerns around demand and the macroeconomic backdrop. While not a downgrade in rating, the lower target reflects more cautious expectations for earnings recovery.
🧮 These mixed moves suggest analysts are navigating a fine line—acknowledging Winnebago’s brand strength and cash flow generation, but balancing that with near-term market headwinds that could keep the stock range-bound.
Earnings Report Summary
A Softer Quarter, but Some Bright Spots
Winnebago’s most recent earnings came in with results that clearly reflect the broader slowdown in the RV industry. For the fiscal second quarter of 2025, the company pulled in $620.2 million in revenue. That’s down about 12% from the same time last year, mostly because of a shift in product mix that led to a lower average selling price per unit. You can see the impact of cautious consumer spending across the board, and it’s weighing on both sales volume and margins.
Gross profit slid to $83.1 million from $105.3 million a year ago. That pushed gross margins down to 13.4%, and operating income took a bigger hit—coming in at just $7.8 million compared to $35.4 million last year. The bottom line wasn’t much better, with a net loss of $0.4 million, or $0.02 per share. That’s still an improvement over last year’s $12.7 million loss, so not all bad news. On an adjusted basis, earnings were $0.19 per share, quite a bit lower than the $0.93 from the same quarter a year ago.
Segment Breakdown Tells the Story
Looking at the individual business segments, there’s a bit more texture. Towable RVs actually saw a slight uptick—revenue rose just over 1% to $288.2 million. The volume was stronger, but the shift toward lower-priced models held back the overall dollar growth.
The Motorhome segment didn’t fare as well. Revenue fell sharply—about 30% lower than the same quarter last year—landing at $235.6 million. Dealers are clearly tightening up their orders, likely due to higher financing costs and bloated inventories they’re still working through.
The bright spot came from Winnebago’s Marine business. That unit saw revenue climb more than 17% to $81.7 million. Demand for boats held up better, and the company seems to be picking up market share in that space, which helped lift the numbers despite the tougher backdrop.
Adjusted Outlook Moving Forward
Given all the moving parts, management dialed back its full-year guidance. Winnebago now expects revenue between $2.8 and $3.0 billion, a slight cut from their prior forecast. Adjusted earnings per share are expected to land somewhere between $2.75 and $3.75. With RV demand still under pressure and some softness creeping into marine, they’re bracing for a challenging rest of the year. Still, leadership sounded confident in their ability to manage through it and stay focused on long-term positioning.
Chart Analysis
Price Action and Moving Averages
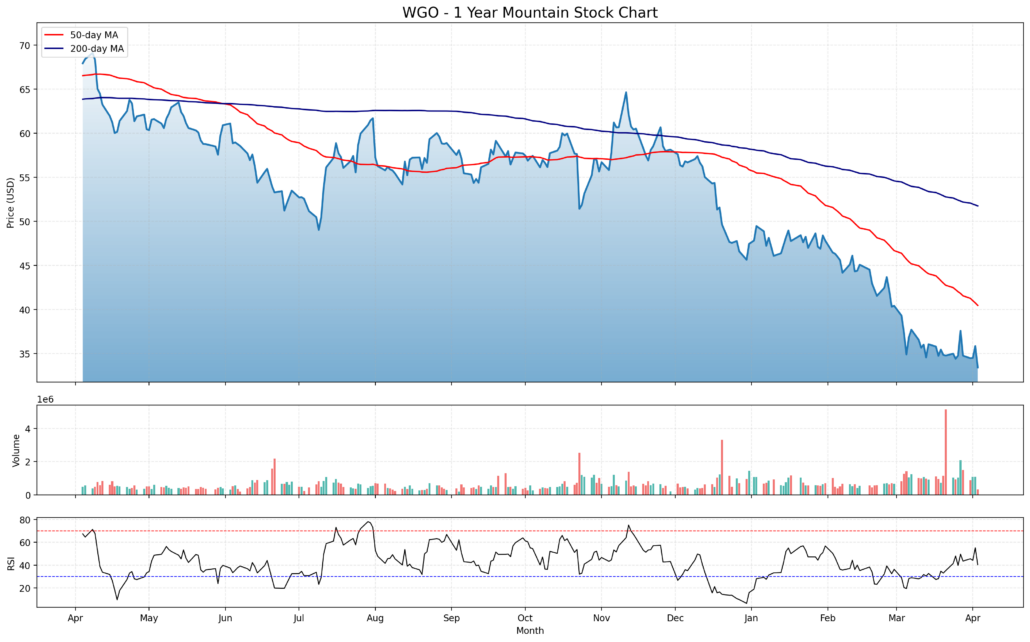
WGO has been under steady selling pressure over the past year, and the chart paints a clear picture of that prolonged downtrend. The price has declined from the high $60s to the low $30s, nearly cutting the stock in half. The 50-day moving average continues to slope downward and remains well below the 200-day, confirming the persistent bearish momentum. There’s been no real attempt yet to flatten out or signal a reversal.
What’s striking is the consistency of the trend. There haven’t been any meaningful rallies to suggest buyers are stepping in with conviction. Even short-lived recoveries have quickly rolled over. The stock remains deeply under both moving averages, and unless that changes, this looks like a market still in control of the sellers.
Volume Trends
Volume has picked up during the more aggressive selloffs—especially noticeable in late December and again in March. That tells us the market isn’t just drifting lower on low activity; there’s been decisive action to unload positions. On the flipside, recovery days have generally come on lighter volume, which makes them less convincing as potential turning points.
There’s also a pattern of volume spikes without much follow-through in price. That could suggest some short covering or brief accumulation, but nothing with real legs yet. Buyers haven’t taken control for any sustained period.
Relative Strength Index (RSI)
RSI mostly stayed below the midline for a good part of the year, which matches the price action. There have been a few moves toward the overbought zone, but they didn’t stick around long. More recently, RSI has been hovering in the 40s and 50s, signaling a modest bounce off oversold conditions but not enough to build a strong case for a trend change.
If there’s anything to watch here, it’s whether RSI can start building higher lows while price stays relatively flat or even edges higher. That kind of divergence might be one of the first clues that downward momentum is starting to fade.
Technical Takeaway
The long-term trend in WGO is still clearly down. Price action, volume behavior, and RSI all point to a market that hasn’t quite found its bottom. While the stock has stabilized somewhat in recent weeks, it hasn’t done enough yet to shift the broader technical outlook. The setup still leans cautious unless signs of accumulation and strength start to emerge.
Management Team
At the helm of Winnebago Industries is President and CEO Michael Happe, who has led the company since early 2016. His tenure has been marked by significant portfolio expansion, including the strategic push into the marine segment with acquisitions that helped diversify revenue streams. Happe has focused on modernizing the business and driving a more customer-centric approach, particularly by blending traditional RV design with newer tech-forward features.
Bryan Hughes serves as Chief Financial Officer and Senior Vice President. He’s responsible for managing the company’s financial operations and long-term strategy. His background in corporate finance and risk management adds stability in what is often a volatile industry. The broader leadership team includes Ashis Bhattacharya, who heads advanced technology and engineering initiatives, and Stacy Bogart, overseeing legal affairs and corporate social responsibility efforts. Together, this team brings a blend of operational expertise and forward-thinking leadership aimed at guiding the company through both market cycles and innovation demands.
Valuation and Stock Performance
Winnebago’s stock performance over the past year has been difficult, with the share price falling from above $70 to the low $30 range. That steep drop has pulled valuation metrics into more attractive territory for value-focused investors. The price-to-sales ratio sits around 0.4, which is considerably lower than the broader industry average. Meanwhile, forward price-to-earnings ratios are now in the low teens, suggesting the stock may be trading below its intrinsic value.
The company’s book value per share is over $43, which means the stock is now trading well below its book value. That can be a signal of undervaluation, though in a cyclical industry, it can also reflect market expectations of continued earnings pressure. Still, on a relative basis, WGO appears inexpensive, especially if earnings stabilize or improve in the coming quarters. The question remains whether this is a value trap or a longer-term opportunity as the market works through its current downturn.
Risks and Considerations
Winnebago operates in a business that’s closely tied to economic cycles. When interest rates rise or consumer sentiment dips, sales of RVs tend to fall quickly. The recent environment—marked by high borrowing costs and fading post-pandemic demand—has created a tough backdrop. Guidance has been lowered, and market share in certain segments remains under pressure. While the marine business is showing strength, it may not be enough to offset broader softness in the core RV market.
Another point to consider is recent customer feedback regarding certain product issues. Any widespread perception of quality concerns can hurt brand trust and, over time, weigh on sales and margins. With competitors in the space also vying for market share, Winnebago will need to stay ahead with innovation and after-sales support. Additionally, raw material inflation and supply chain disruptions, though easing, still pose a threat to profitability if not well-managed.
Final Thoughts
Winnebago Industries has the history, leadership, and brand recognition to weather market cycles, but the near-term outlook is undeniably challenging. Management has shown commitment to long-term shareholder value, both through acquisitions and capital return programs. While the current valuation may appeal to those with a longer investment horizon, the road ahead is dependent on how effectively the company navigates ongoing headwinds.
Execution will matter more than ever—whether it’s managing costs, maintaining product quality, or tapping into emerging consumer preferences. For investors comfortable with some near-term volatility and familiar with cyclical industries, this could be a name worth monitoring closely as the broader economic picture evolves.