

Updated April 2025
Tennant Company isn’t a name that shows up in flashy headlines, but that’s exactly why it works for some investors. Founded back in 1870, this Minneapolis-based business focuses on floor cleaning machines—those sturdy scrubbers and sweepers you’ll find in warehouses, factories, and public spaces. It’s not a glamorous business, but it is a solid one.
The company has built a dependable global operation over the years. While the bulk of its revenue still comes from North America, international markets are quietly becoming a bigger piece of the pie. Tennant isn’t in a rush to impress Wall Street. Instead, it’s focused on doing what it does best: manufacturing quality equipment and steadily returning cash to shareholders.
For income-focused investors, particularly those hunting for reliable dividends, Tennant’s quiet consistency is where the value lies.
Recent Events
Tennant’s stock has had a rocky 12 months. Shares have slid more than 34% from their 52-week high of $124.11 and are now hovering near the bottom end of the range, around $80.30. Market cap has taken a hit too, dipping from over $2.3 billion down to $1.51 billion. But that doesn’t necessarily mean trouble.
While the latest quarter showed a steep 78.7% drop in year-over-year earnings, revenue actually ticked up by 5.6%. That kind of earnings compression could be due to a number of short-term pressures—higher costs, shifts in product mix, or one-time expenses. What matters more is that Tennant is still running a profitable business, with a 6.5% net margin and an operating margin just under 5%.
From a financial health standpoint, Tennant looks solid. The company holds nearly $100 million in cash and has a comfortable current ratio of 1.97. Debt levels are manageable, with total debt of $254.5 million and a debt-to-equity ratio under 41%. It’s not overleveraged, which gives it breathing room even in a tougher operating environment.
Key Dividend Metrics
📈 Forward Dividend Yield: 1.47%
💵 Annual Dividend Rate: $1.18 per share
📅 Most Recent Dividend Date: March 14, 2025
🚪 Ex-Dividend Date: February 28, 2025
🧮 Payout Ratio: 25.91%
📊 5-Year Average Yield: 1.31%
💸 Free Cash Flow (TTM): $107.66 million
These numbers may not jump off the page, but for investors who care more about reliability than excitement, they tell a comforting story.
Dividend Overview
At first glance, a 1.47% yield might not grab you. It’s not high enough to be considered a top-tier income play. But what makes Tennant stand out is the way it treats its dividend—not as a flashy gesture, but as a steady promise.
The company pays out less than 26% of its earnings in dividends. That’s low, and that’s a good thing. It means there’s plenty of cushion if earnings take a hit, like they just did. This isn’t a business scrambling to meet its dividend commitment. It’s one that prioritizes stability over showmanship.
And while the yield is just a tick above its 5-year average, the underlying support is strong. Tennant’s free cash flow for the trailing twelve months is more than enough to cover its dividend payments. That’s real money, not just accounting profits.
Importantly, Tennant has kept its dividend going through different market cycles. There’s no history of erratic cuts or skipped payments. If anything, management has quietly made sure the payout grows—even if it’s just a little—year after year.
Dividend Growth and Safety
This is where Tennant really earns a nod from long-term income investors.
Dividend growth hasn’t been explosive, but it has been dependable. Over the past decade, the company has made it a point to increase its dividend annually. We’re not talking about dramatic hikes, but about a consistent upward slope. That kind of track record builds confidence.
The pace of dividend growth over the past five years has hovered just under 5% annually. That might not make headlines, but it’s sustainable—and sustainability is often underrated in this space.
Financially, the company looks well-equipped to keep this going. It ended the last quarter with $99.9 million in cash and reported $89.7 million in operating cash flow. With a payout ratio comfortably below 30%, there’s no immediate pressure to scale back.
Debt is under control. The company isn’t aggressively leveraged, and its debt-to-equity ratio of 40.91% reflects that. With interest rates where they are, that kind of restraint is key to protecting shareholder payouts.
Return on equity is at nearly 14%, and return on assets stands at 6.65%. These aren’t monster numbers, but they reflect efficient use of capital—again pointing to a company that knows how to manage its resources without overextending.
And one more detail worth noting: institutions hold almost 97% of Tennant’s shares. That kind of ownership doesn’t guarantee anything, but it does suggest the market sees long-term value in the business and trusts the leadership team’s strategy.
In a market that can swing wildly, Tennant offers something quieter: steady execution, a healthy balance sheet, and a dividend that does its job without demanding the spotlight. For investors who prefer their income streams boring and dependable, that’s not a bad combination at all.
Chart Analysis
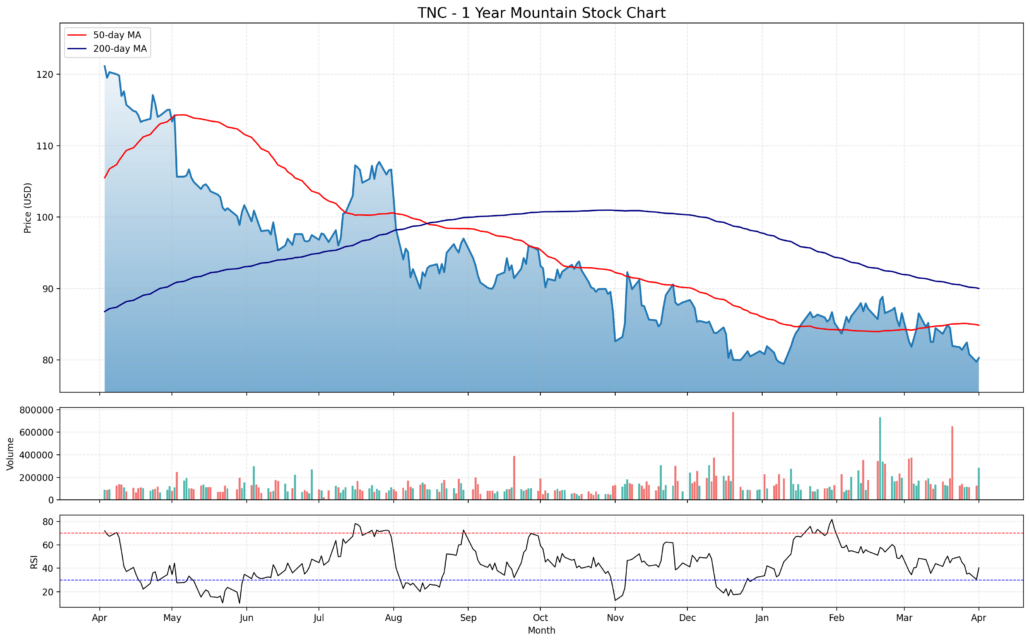
Long-Term Trend
Looking over the past year, the overall trend for Tennant Company’s stock has clearly been to the downside. It began last spring trading above $120, but has steadily stepped lower through the months, now sitting closer to the $80 mark. The steady decline isn’t a crash—this looks more like a drawn-out correction.
Both the 50-day and 200-day moving averages reinforce the bearish structure. The 50-day MA (red) crossed below the 200-day MA (blue) back in mid-August—a classic death cross—and has stayed below since. That kind of technical setup tends to signal longer-term weakness. More importantly, the moving averages are still pointing downward, showing no immediate sign of reversal or flattening out.
Price Action and Behavior
The price made several attempts to rally, particularly in late summer and again in early February, but each move met resistance and rolled over. The lower highs and lower lows are textbook signs of a market in a markdown phase—where rallies tend to get sold rather than bought. Lately, price action has tightened, hovering around a narrowing band near the recent lows, just above $78.
The chart also reflects a noticeable breakdown in early September where price slipped sharply below support around $95 and never quite recovered. That move set the tone for the second half of the year.
Volume Clues
Volume has remained mostly average, with a few sharp spikes on red candles—especially during the dips in September and January. Those selloffs brought increased volume, suggesting institutional unloading or more aggressive selling pressure during those periods. More recently, there’s been no clear uptick in buying volume, which means accumulation hasn’t kicked in yet in any meaningful way.
Even in March, where the price attempted to stabilize, there wasn’t enough sustained green volume to suggest a true bottom is forming. For now, the selling volume outweighs the buying, and that leans toward continued weakness or sideways drift.
Momentum and Relative Strength
Looking at the RSI (Relative Strength Index), momentum remains subdued. The RSI has mostly stayed under the 50 mark for the bulk of the year, only briefly poking above during late January and early February. Those peaks lined up with the small rally attempts, but they didn’t have staying power.
As of now, the RSI is heading back down toward the 30 level, indicating another dip into oversold territory might be coming soon. But it hasn’t yet triggered the kind of extreme oversold condition that often precedes a stronger bounce. Until that happens, momentum is still leaning bearish.
Recent Candle Activity
Zooming in on the most recent five candles, price is once again pressing lower, with little energy behind upward moves. The last few sessions show smaller bodies and wicks on top, which often reflects selling into strength. That’s not a great look if you’re hoping for a bounce. Sellers remain in control near current levels, and any attempt to climb has been capped quickly.
There’s no strong reversal candle among the five. No hammer, no bullish engulfing—just continuation of softness, with mild intraday recovery attempts that don’t hold into the close.
The chart paints a clear picture: Tennant has spent the past year in a methodical markdown phase, with consistent downward pressure and no sign yet of a base forming. Price remains under both key moving averages, and recent candles don’t suggest a shift in momentum. Volume and RSI back that up. While the longer-term story for the company may hold value, the stock itself hasn’t signaled technical strength just yet.
Balance Sheet Analysis
Tennant Company’s balance sheet over the past few years has been quietly getting stronger, almost like someone who starts lifting weights just for fun and ends up accidentally fit. Total assets grew from just over $1.06 billion in 2021 to $1.19 billion by the end of 2024. At the same time, liabilities have actually shrunk since their 2021 peak of $626 million, landing at $568 million most recently. That drop in liabilities combined with a bump in equity—now sitting at $622 million—paints a picture of a business that’s steadily building financial muscle without taking on unnecessary risk.
The company has also made real progress in bolstering its tangible book value, more than doubling it since 2021. Net debt has dropped meaningfully too, from $222 million in 2022 to under $100 million by the end of 2024. That’s a material improvement and not just accounting fluff. Working capital remains healthy, though it’s drifted slightly downward in the most recent year. Still, the company isn’t looking strapped—it’s just not letting excess capital sit idle. There’s no sign of reckless spending or balance sheet bloat. Debt is very manageable, and equity growth outpaces debt accumulation, which is about as boringly responsible as you’d want a company to be.
Cash Flow Statement
Tennant’s most recent cash flow performance shows a company that’s scaled back from prior highs but remains fundamentally sound. For the trailing twelve months, operating cash flow came in at $89.7 million—down sharply from the $188 million seen the year before, yet still a solid number. Free cash flow sits at $68.3 million, showing the business is generating enough to cover its needs without tapping into debt unnecessarily. The shift from negative operating cash flow in 2021 to positive in recent years is a sign of tightening operational efficiency.
On the investing side, Tennant spent $78.4 million, much of it likely going into capex and longer-term assets. Financing activities were a drag of $25.2 million, largely driven by debt repayments and continued share repurchases. The company repaid more debt than it issued, showing a disciplined approach to leverage. And despite a pullback in cash from the prior year, it ended the period with nearly $100 million on hand—plenty of dry powder if needed. There’s no drama here, just a quiet business keeping its financial house in order.
Analyst Ratings
📈 In recent months, Tennant Company (TNC) has caught the attention of analysts, leading to updated ratings and fresh price targets. EF Hutton reiterated a “Strong Buy” rating and set a price target of $150 back in May 2024. That optimistic stance was fueled by the company’s consistent financial footing and some strategic steps aimed at expanding its reach in the commercial cleaning space.
🔍 Not long after, Northcoast Research also stepped in with a “Strong Buy” of its own, targeting $125 per share. What stood out to them was Tennant’s clean balance sheet and the steady, reliable nature of its revenue model. For a company in an industry that doesn’t often see dramatic swings, those fundamentals spoke volumes.
📊 Taking a wider view, analysts as a group seem to be leaning in a positive direction. The average price target hovers around $128, with a range from $120 on the conservative side to as high as $139. That suggests a decent upside of roughly 59% from where the stock is trading now.
🧠 A lot of this comes down to the confidence in Tennant’s market positioning and execution. Whether it’s improved margins, strategic global moves, or product innovation, analysts are clearly seeing reasons to stay bullish.
Earning Report Summary
Solid Revenue Growth
Tennant Company closed out 2024 with a strong top-line performance. In the fourth quarter alone, net sales reached $328.9 million, which marked a 5.6% increase over the same period last year. The company saw encouraging momentum in the Americas and EMEA regions, where sales volumes helped drive growth. For the full year, Tennant posted $1.287 billion in revenue—up 3.5% from 2023. That’s not a bad run for a business built around industrial floor scrubbers and commercial cleaning systems. Even better, adjusted EBITDA improved 8.2% year over year, hitting $208.8 million with a margin of 16.2%. That margin expansion is a nice sign of underlying strength.
Profit Takes a Breather
While revenue and EBITDA moved in the right direction, bottom-line profit told a different story. Net income for the year came in at $83.7 million, down about 24% from the year before. The dip wasn’t entirely surprising, though. Tennant had higher operating expenses tied to modernizing its ERP system, and there were some legal costs that weighed things down. Despite the earnings drop, cash generation remained healthy. Operating cash flow came in at $89.7 million, and the company still had room to return $41 million to shareholders through dividends and buybacks. In fact, the board just approved a new repurchase plan covering up to 2 million shares, showing confidence in the business going forward.
Looking Ahead
Tennant is setting a cautious tone for 2025, guiding for a modest sales dip—anywhere from 1% to 4% down organically. But management isn’t hitting the panic button. The focus appears to be on tightening operations and squeezing out more efficiency, which could help margins continue to improve. Investments like the ERP project are laying the groundwork for longer-term growth. Add in Tennant’s ongoing product innovation and global market efforts, and it seems like the company is keeping one eye on stability and the other on future expansion. It’s not flashy, but it’s purposeful—and that can count for a lot in a sector that thrives on consistency.
Management Team
At the helm of Tennant Company is David W. Huml, who’s been leading as President and CEO since March 2021. Huml originally joined the company in 2014 and brought more than 25 years of global experience in areas like product management, marketing, and business leadership. He’s known for pushing forward growth strategies, encouraging innovation, and successfully navigating acquisitions—all while keeping a grounded and steady approach.
Backing him is Fay West, Tennant’s Senior Vice President and CFO. She plays a central role in shaping the financial strategy and maintaining fiscal discipline. The rest of the leadership team brings a healthy mix of experience and fresh perspective, with backgrounds spanning operations, technology, and customer service. That diversity in experience has helped Tennant stay competitive while pushing into new markets and product categories.
Valuation and Stock Performance
Tennant’s stock hasn’t had the smoothest ride recently. Over the past year, the share price has ranged from a low near $78 to a high above $124. As of early April 2025, the stock is sitting around $80, which is closer to the lower end of that range.
From a valuation standpoint, the stock’s trailing price-to-earnings ratio is around 18, while the forward P/E is more favorable, closer to 13. That implies expectations for earnings growth in the year ahead. The price-to-sales ratio sits around 1.16 and the price-to-book ratio hovers just over 2.4, both pointing to a company that’s not exactly cheap, but not overly stretched either. It’s in that middle ground where valuation is reasonable—especially for a business with reliable cash flows and steady dividend payouts.
Risks and Considerations
While Tennant has plenty going for it, no company is immune to risk. One obvious area is the supply chain—any hiccups with raw materials or logistics can ripple through operations. The business also faces consistent pressure from competitors, especially in a space where product differentiation isn’t always easy to maintain over time.
Another area to watch is Tennant’s move into automated and robotic cleaning technology. It’s an exciting direction, but with new innovation comes the risk of product recalls, technical glitches, or slow adoption from customers. There’s also the ongoing concern that international exposure could bring challenges from geopolitical tension, shifting regulations, or economic slowdowns abroad.
Final Thoughts
Tennant Company has proven itself to be a steady operator in a niche but essential industry. With a leadership team that’s both experienced and forward-thinking, the company is positioning itself well for future opportunities. Financially, the fundamentals appear healthy, and the current valuation doesn’t seem overdone.
Of course, investors should stay mindful of the risks tied to innovation and broader market forces. But for a company that’s been around since the 1800s and continues to adapt, there’s something to be said for the kind of consistency Tennant quietly delivers.