

Updated April 2025
TD SYNNEX (NASDAQ: SNX) isn’t the kind of company you hear about every day. It doesn’t chase the limelight or dominate tech headlines. But make no mistake—this is a heavyweight in the world of IT distribution. Since its formation through the merger of Tech Data and SYNNEX in 2021, the company has quietly built a $60 billion revenue engine that connects the biggest tech names with the businesses and institutions that rely on them.
You’ll find SNX behind the scenes, keeping global supply chains humming and helping technology products reach the people who need them. It’s a business built on relationships, logistics, and sheer scale. And while it may not be a traditional darling of dividend-focused portfolios, it deserves a serious look from income investors who value consistency and capital discipline.
Let’s dive into what’s been happening lately, how the dividend stacks up, and why SNX might be a name worth knowing if you’re playing the long game.
Recent Events
Over the last year, TD SYNNEX shares have been drifting down after hitting a high around $145 last summer. As of early April, the stock trades closer to $104—a notable drop of more than 25%. While the broader market has been making upward strides, SNX has been going the other way.
Earnings have had a hand in that. The most recent report showed a 2.7% decline in quarterly EPS year-over-year. On top of that, free cash flow turned negative, with the company posting a levered FCF of nearly -$146 million over the past 12 months. Not great numbers if you’re just scanning the headlines.
But here’s what’s not grabbing attention: the core business is still humming along. Revenue is up 4% year-over-year, gross profit remains steady, and the operating margin is holding just above 2%. For a distribution company in a margin-tight industry, that’s a sign of tight execution.
Debt is being managed carefully, with a debt-to-equity ratio just under 54%. The current ratio of 1.27 shows the balance sheet isn’t under pressure. It’s a company focused on doing the little things right, and sometimes that matters more than fireworks.
Key Dividend Metrics 📊
📈 Forward Dividend Yield: 1.69%
💸 Trailing Dividend Yield: 1.62%
💰 Annual Dividend Payout: $1.76 per share
🔄 Dividend Growth (5-year average): Estimated at 13.4%
🧱 Payout Ratio: 20.5%
🔒 Dividend Safety: Appears strong
📅 Next Ex-Dividend Date: April 11, 2025
💵 Next Payment Date: April 25, 2025
These aren’t numbers that will turn heads for high-yield hunters. But what they do offer is a solid, sustainable base—backed by earnings and supported by a careful management team.
Dividend Overview
Let’s call this what it is: a quietly confident dividend payer.
At a forward yield of just under 1.7%, TD SYNNEX isn’t trying to lure investors with promises of high income. Instead, it’s offering something more subtle—an income stream you can likely count on, with room to grow.
The payout ratio sits comfortably at 20.5%, which tells you a lot. This isn’t a company stretching to maintain its dividend. It’s paying out what it can easily afford, and keeping the rest for growth, debt management, and reinvestment. That’s the kind of approach dividend investors can respect.
Cash on the balance sheet stands at over $540 million, giving SNX plenty of breathing room. Debt is present, but it’s not burdensome. With predictable operating cash flow, even in a softer earnings environment, the dividend doesn’t look remotely at risk.
Investors looking to catch the next payment should keep an eye on the calendar. The stock goes ex-dividend on April 11, with the payment set for April 25. It’s a nice bump for anyone building a quarterly income stream.
Dividend Growth and Safety
Here’s where the story gets a little more interesting.
TD SYNNEX may not be known for its yield, but the growth in its dividend has been quietly impressive. While not formally stated every quarter, recent history shows a consistent pattern of double-digit percentage increases. That doesn’t just happen unless a company feels confident about its trajectory.
The valuation adds a bit of appeal, too. SNX is trading at a forward P/E under 9 and a PEG ratio well below 1. That kind of pricing implies both a value tilt and the potential for modest growth, which makes continued dividend hikes all the more likely.
And there’s no stretch here—earnings are more than covering the payout. With diluted EPS at $8.00 over the trailing twelve months, SNX is distributing just a fraction of that back to shareholders. That’s the type of dividend safety net that long-term investors should appreciate.
Chart Analysis
Price Action and Trend Behavior
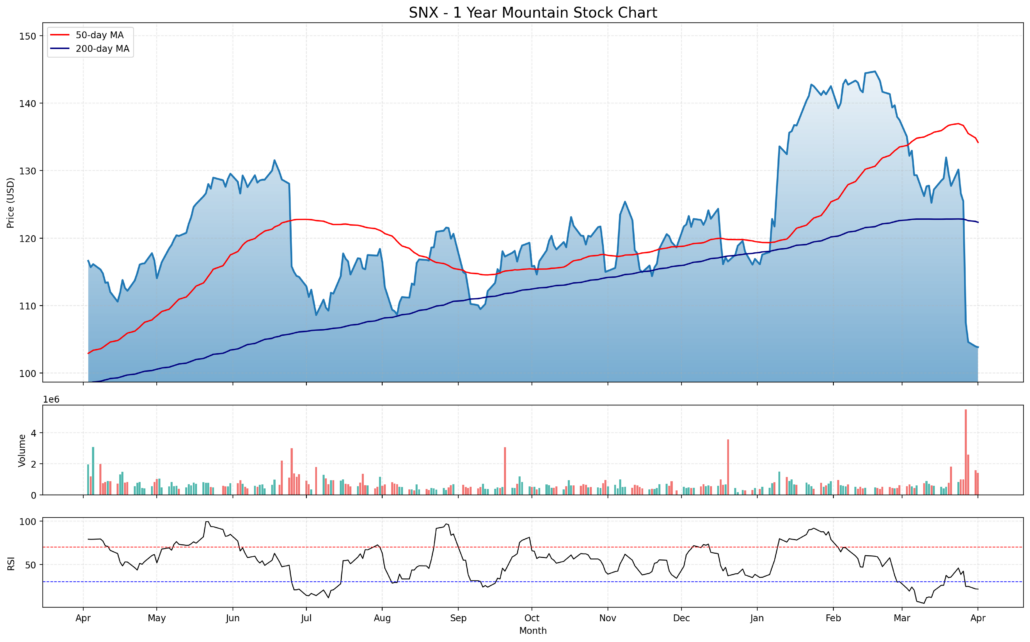
Looking at the one-year chart for SNX, the overall trajectory tells a story of early momentum followed by sustained consolidation, and more recently, a sharp breakdown. Price climbed steadily from April through early June, pushing from around $107 to a peak above $130. This stretch was characterized by higher highs and higher lows—classic signs of strength in a trending market.
But by late June, that momentum began to stall. The price entered a wide range-bound phase lasting several months, bouncing between roughly $110 and $125. This was a textbook consolidation zone. While not aggressive, the bulls were losing steam, and sellers gradually stepped in each time price approached resistance levels near the $125 mark.
Things started to pick up again heading into December and January, with a renewed push to fresh highs—this time touching close to $145. But the move lacked staying power. A swift reversal followed in February, marked by heavier volume and an increasingly bearish tone.
Moving Averages
The red 50-day moving average crossed above the 200-day moving average late last year, which is usually a positive signal. However, that crossover has since reversed. The 50-day has started to slope downward, now moving back below the 200-day line. This shift reflects a breakdown in the medium-term trend and confirms that recent selling pressure isn’t just a blip—it’s part of a deeper reset.
The price is now trading decisively below both moving averages. That’s not just a technical footnote—it signals that market participants are reevaluating the stock’s short-term valuation. These are the kinds of crossovers that often precede a period of base-building or continued weakness until stronger demand steps back in.
Volume Trends
Volume has picked up significantly in the most recent weeks, particularly during the selloff in late March. That spike in participation isn’t accidental. It shows distribution—larger holders exiting positions while retail and smaller hands absorb supply. Earlier in the chart, volume remained fairly subdued during consolidation phases, which made sense given the tight range. But the latest surge adds weight to the recent drop, confirming that the decline isn’t just a result of thin trading conditions.
The size and consistency of the red volume bars also support the idea that this is a genuine exit rather than just short-term volatility.
Relative Strength Index (RSI)
The RSI dipped well into oversold territory in March, touching levels below 30 before curling back upward toward neutral. That move lower confirms that the selloff was both aggressive and, potentially, overextended in the short term.
Since then, RSI has climbed modestly, but not convincingly. It’s now hovering near the middle of the range—neither oversold nor overbought. This lack of conviction in RSI suggests indecision. There isn’t yet enough buying strength to signal a reversal, but the sharpness of the previous drop also means a short-term bounce can’t be ruled out.
Final Takeaways from the Chart
The recent breakdown in SNX’s chart marks a clear shift in sentiment. For much of the past year, the stock had been grinding higher with modest pullbacks, supported by steady demand. But the latest price action shows a decisive change. With price now sitting well below its moving averages and volume accelerating on down days, the chart reflects a cautious stance by the market.
This could be the beginning of a reset phase—where the stock tries to establish a new base after digesting the prior run. The trend has clearly broken down, and until price can reclaim those moving averages, especially the 200-day, it remains in a vulnerable spot technically.
For those watching the longer picture, what matters now is how the stock behaves in this new lower range. Signs of stabilization—sideways price action, decreasing volume, or RSI flattening—would suggest the selling pressure is easing. But until then, the chart signals caution, and patience may be key.
Balance Sheet Analysis
TD SYNNEX’s balance sheet shows the kind of consistency that comes from a company used to managing tight margins and big volumes. Total assets crept up to just over $30.2 billion in the latest report, a modest bump from the previous year. That’s not fireworks, but it reflects controlled growth without overextension. Liabilities also nudged higher, now sitting at $22.2 billion, which means the equity position remains intact at just over $8 billion. That’s pretty flat year-over-year, and that kind of steadiness is worth something in a sector where everything moves fast.
Now let’s talk about the number that always gets a second glance—net tangible assets. Yes, they’re positive now. Barely. After years of living in the red, SNX has climbed its way up to a whopping $228 million. Not exactly enough to throw a party, but hey, at least they’re not underwater anymore. On the debt front, the company has trimmed its total debt slightly from a year ago, landing at just under $3.91 billion. Net debt also improved a bit, signaling they’ve kept things in check. Working capital is healthy at over $4.1 billion, giving them the flexibility to move when needed. Overall, it’s a balance sheet that says: we’re not flashy, but we know how to keep the lights on and the gears turning.
Cash Flow Statement
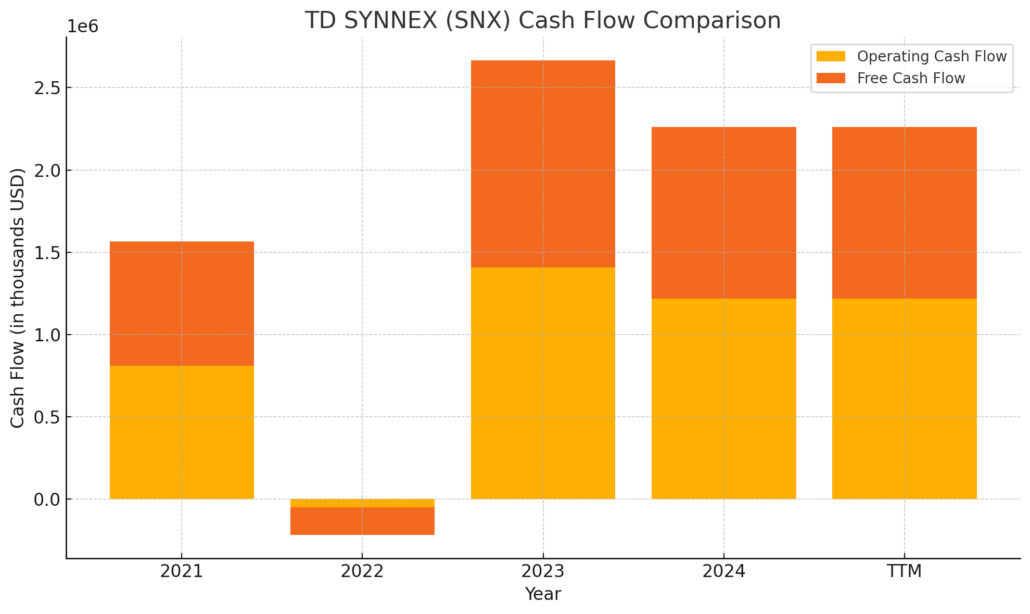
TD SYNNEX’s cash flow statement over the trailing twelve months reflects a business that’s still spinning off solid operational cash despite some pressure points. Operating cash flow came in at just over $1.2 billion, slightly down from the previous year but still comfortably positive. After capital expenditures, free cash flow clocked in at a healthy $1.04 billion. That’s not bad at all, considering the previous few years have shown some volatility, including a brief dip into the red in 2021.
On the financing side, it’s clear the company did some spring cleaning. Debt repayments outweighed new borrowings by about $176 million, and they returned a sizable chunk to shareholders through buybacks—over $636 million in repurchased stock. Cash used in financing totaled a hefty $953 million. Even with that level of outflow, the company increased its cash position slightly to just over $1.05 billion. In other words, they’re spending, but not in a reckless way. They’re managing debt, investing modestly, and still holding onto more than a billion in cash. Not a bad place to be.
Analyst Ratings
In recent weeks, TD SYNNEX (SNX) has experienced a mix of analyst actions reflecting shifting market sentiment. 🧐 StockNews.com recently downgraded the stock from a “buy” to a “hold” rating, signaling a more cautious outlook. This change may have been driven by concerns about short-term performance challenges or macroeconomic uncertainty weighing on IT distributors.
On the flip side, CFRA upgraded SNX from a “hold” to a “buy” earlier this year and nudged their price target up from $122.00 to $147.00. 📈 That kind of move typically reflects confidence in the company’s strategic direction, possibly driven by expectations of better operating leverage or improving market share in the tech distribution space.
Meanwhile, Barclays took a more reserved stance, lowering its price target from $148.00 to $125.00 while sticking with an “equal weight” rating. ⚖️ That adjustment might stem from a more tempered view on enterprise tech spending or concerns about margin pressure across the sector.
As of early April, the overall analyst consensus for SNX is categorized as a “Moderate Buy.” 🎯 The average price target sits around $140.00. On the high end, some analysts see the stock reaching $165.00, while others are more conservative, setting their expectations closer to $125.00. This range shows a market still deciding how much upside SNX can realistically deliver in the coming quarters.
Earning Report Summary
Revenue and Regional Performance
TD SYNNEX kicked off fiscal 2025 with a steady start, reporting first-quarter revenue of $14.53 billion. That’s up about 4% from the same period last year—not explosive growth, but a solid move in the right direction. What helped the numbers was stronger performance in the Americas and Asia-Pacific-Japan regions, both showing healthy revenue increases. North America, in particular, held its ground well and continues to be the company’s core engine.
Margins and Profitability
While top-line growth looked decent, margins told a slightly different story. Gross profit landed at $998 million, which was actually down a bit from last year. The gross margin slipped to 6.87%, thanks in part to some shifts in the product mix. Basically, they didn’t sell quite as much of the higher-margin stuff this time around. Operating income was fairly flat, just over $304 million, while adjusted (non-GAAP) operating income came in a touch lower than the year before.
Bottom Line and EPS
Net income dipped slightly to $167.5 million, a drop of around 2.7%. On a per-share basis, GAAP earnings actually nudged higher to $1.98, but adjusted earnings per share came in at $2.80, down from $2.99. So while the company kept things steady, it didn’t wow anyone with earnings growth this quarter.
Cash Flow and Capital Returns
The biggest surprise in the report came from the cash flow line. Operating activities used up $748 million—quite the reversal from the $385 million they generated during the same time last year. Free cash flow was also in the red, down $790 million, which isn’t ideal but could reflect short-term working capital shifts. Even with that, they returned $138 million to shareholders through dividends and buybacks.
Looking Ahead
For the second quarter, TD SYNNEX is expecting revenue between $13.9 billion and $14.7 billion and adjusted EPS between $2.45 and $2.95. It’s a cautious forecast and slightly below what analysts were hoping for, but it shows the company is being realistic about the current environment.
Management Team
TD SYNNEX has seen some meaningful leadership changes recently, all geared toward steering the company through the rapidly evolving tech landscape. In September 2024, Patrick Zammit stepped into the role of Chief Executive Officer and joined the Board of Directors. Before that, he was the Chief Operating Officer, so he’s not exactly new to the inner workings of the company. He brings deep operational experience and a solid track record of execution.
Backing Zammit is Alim Dhanji, the Chief Human Resources Officer, who oversees the company’s global HR efforts. His focus has been on talent strategy, diversity and inclusion, and ensuring a positive workplace culture across more than 100 countries. Meanwhile, Sergio Farache, as Chief Strategy and Technology Officer, is helping shape the future of the company’s offerings and innovation priorities.
Another key appointment was Reyna Thompson, who took over as President of North America in December 2024. She’s been with the company since the early ’90s and brings a long history of leading high-growth areas like cloud and cybersecurity. With this team in place, TD SYNNEX seems well-positioned to tackle both the opportunities and the complexities of a global IT distribution business.
Valuation and Stock Performance
As of early April 2025, TD SYNNEX shares are trading around $103.85. The past 12 months have been a bit of a ride, with the stock hitting a high of $145.10 and dipping as low as $98.00. It’s been a year marked by volatility, and much of that reflects broader shifts in tech sector sentiment and expectations around enterprise IT spending.
From a valuation perspective, the stock looks fairly reasonable. The trailing P/E sits at about 13, while the forward P/E is closer to 8.5, hinting that the market expects earnings to improve. Its price-to-book ratio is around 1.07, which tells us shares are trading right around the value of the company’s net assets—not too stretched, not too discounted.
Analysts seem moderately optimistic. The consensus rating is a “Moderate Buy,” with the average price target hovering around $140. That suggests there’s some confidence in a rebound from current levels, assuming the company executes well and macro headwinds ease a bit.
Revenue is growing, albeit slowly. The most recent quarter showed a 4 percent uptick year-over-year. However, gross profit and margins have been a little softer, and that’s weighed on earnings and cash flow. Still, this is a business with deep partnerships, a broad portfolio, and global scale—factors that typically support long-term value creation.
Risks and Considerations
There are several key risks worth keeping in mind with TD SYNNEX. First, competition in the IT distribution space is fierce. The company has to continually evolve to stay relevant as technology shifts and new players enter the arena. Scale helps, but agility is just as important in a space that doesn’t sit still for long.
Operational risks are also real. With massive product inventories and global logistics, things like warehouse damage or security issues can quickly hit margins. Then there’s economic sensitivity. When the economy slows or corporate tech budgets get tighter, demand for the very products TD SYNNEX distributes can shrink quickly.
Integration risk is another one to watch. Since the merger that created the current iteration of the company, there’s always the challenge of blending systems, culture, and strategy effectively. So far, they’ve handled it well, but it’s something to keep an eye on.
Finally, with operations spread across many regions, regulatory complexity is a constant concern. From data privacy to trade compliance, the cost of staying within the lines can be significant—and slipping up can have real consequences.
Final Thoughts
TD SYNNEX has a lot going for it—global reach, scale advantages, and a solid track record of profitability. The leadership team brings both experience and fresh energy, and recent strategic appointments suggest they’re thinking carefully about where the business is heading. The valuation appears reasonable given the company’s fundamentals and market positioning.
Still, it’s not without its challenges. Earnings and cash flow haven’t exactly wowed recently, and macro pressures are real. But the company has shown it can adapt and manage through cycles. For those who value a disciplined, quietly capable operator in the tech distribution world, it’s a name that continues to deserve attention.